Tuesday, March 31, 2020

Weather Dances

#1714 "White Pine Island" Pixels Link
No, this is not about the Rain Dance. That is coming in a future Blog. This is all about looking at the weather in a creative and artistic way. With the fundamentals of the previous posts, you may never look at the sky in the same way ever again... and that is a good thing. 

The conveyor belt conceptual model of the wind patterns found with a mid latitude low pressure area, is fundamental to the understanding of cloud configurations. Note that the shorter term “cyclone” is frequently used to replace “low pressure area”. The idealized conveyor belts are best examined in the atmospheric frame of reference relative to the low. The atmospheric frame of reference was described in the first blog “Cloud Shapes and Lines in the Atmosphere”. 

The Conveyor Belt Conceptual Model
The atmospheric frame winds of the conveyor belts relative to the low (note that the red L should really be a red X)  are depicted by the red, orange and blue arrows of the conveyor belt conceptual model. In order to determine the actual wind experienced by an earth bound observer, these colourful winds must be added to the translational motion of the cyclone relative to the earth. Lows typically move west to east following the guiding jet stream. The difference between a rotational centre "X" in the atmospheric frame and a low in earth frame of reference was described in "Rotation is the Key to Unlock Cloud Shapes". The "L" approaches the "X" as the translational speed of the cyclone decreases. The "L" and the "X" become the same when the cyclone stops moving  relative to the earth.

For example, the relative flow of the blue CCB is typically opposite to the normal west to east motion of the cyclone. The motion of the low can thus counter the atmospheric frame motion of the CCB. In the case when the CCB is exactly equal and opposite to the motion of the low, the earth surface winds produced under the CCB must be calm – the so-called “calm before the storm”. If the actual surface winds are westerly then the low is moving faster than the CCB winds and the storm will soon pass. If the surface winds are easterly then the low is moving slower than the CCB winds. Be prepared for a longer duration and significant cyclone. The observation of the surface winds resulting from the sum of the CCB winds and the translation of the cyclone can tell you a lot about the storm. I will describe this further in a coming blog. 

Curling the fingers of your right hand in the direction of the flow at the head of each of these three conveyor belts, will point your thumb either up or down. An upward pointing thumb locates what meteorologists refer to as a positive swirl or vorticity maximum. A downward pointing thumb locates a negative swirl or vorticity minimum. Remember that these companion swirls are linked and part of the same giant smoke ring in the sky. See “The Theory of Unified Swirls”.  Bob Dylan knew that the answer was indeed blowing in the wind. You can imagine the deformation zones at the leading edge of each of these conveyor belts. See “A Closer Look at Lines in the Sky”

Now imagine all of this in three dimensions and mentally project the deformation zones on to the earth. You will find that the warm conveyor belt (WCB) slopes down to the warm front. The dry conveyor belt (DCB) and the cold conveyor belt (CCB) combine and project on the surface cold front. (I had to retire before all of the graphics and animations showing how the CCB and DCB might interact were completed with my friends at COMET.) In any event, fronts are the leading edges of the conveyor belts! Fronts are deformation zones! 

Jacob Bjerknes and his father, Vilhelm Bjerknes, both giants in the world of meteorology, developed the Norwegian cyclone model to explain the generation, intensification and ultimate decay of mid-latitude cyclones. The life cycle of cyclones typically follow similar stages and understanding those steps certainly aid in weather prediction. Their tremendous research was completed during the years of the First World War. They used the word “front” to describe the sharply defined boundaries between air masses. The military terminology was totally understandable.

Vilhem_Bjerknes and baby Jacob
Jacob Bjerknes

Our knowledge of air flows has increased in the last century and it might be a fine time to put a more artistic spin on this science. Weather can be more of a ballet than a battle. Every swirl and every line in the sky can be understood and appreciated for both the exquisiteness of the form and the beauty of the science that they reveal. 

Not a monster... ol' Frank and Fred and both art and science, can and should be your friend

Warmest regards,
Phil the Forecaster

PS: Much more to come.

Tuesday, March 24, 2020

Isentropic Surfaces - Science and Art Merges

#2065 "Summer Cirrus" Pixels Link
My first exposure to meteorology after nuclear physics was in terms of isobaric surfaces. Upper air charts and analyses of the atmospheric were all completed in the world of pressure. Aviation revolved around pressure surfaces and that encouraged meteorologists to do the same. Like the earthly view of the solar system and the universe, mankind first tried to make sense of everything else by placing themselves at the centre of it all.
The atmosphere does not work like that as I described in my very first post “Cloud Shapes and Lines in the Atmosphere”. The motion of air in the atmospheric frame of reference may be even further refined.

Like man, air parcels prefer the easy route that does not require spending any energy. Entropy is a thermodynamic quantity representing the amount of energy in a system (that is no longer available for doing mechanical work). For a parcel of air, entropy is a function of the air temperature, pressure and composition (water vapour, water, or ice).  The potential temperature of an air parcel is a conservative property as long as the entropy of the parcel does not change.  An isentropic chart shows these surfaces of constant entropy. Air parcels can move anywhere along these surfaces for free. I should have started my meteorological training on isentropic charts which are much more in the atmospheric frame of reference. It took me a while to figure this out…

The following graphic is a cross-section of the isentropic surfaces from Texas northward to South Dakota. The blue isentropic lines generally slope upward to the north. Of course weather is more complicated than this but simple truths are a good place to start. 

The pressure axis on the left gives a sense of height and those light grey lines are horizontal on the chart and approximately so in nature. The distance scale is on the bottom. Isentropic surfaces slope upwards towards cold air (when looking along a constant height or constant pressure surface). Alternatively, isentropic surfaces slant downward to the warmest air. Air parcels are restricted to move along these isentropic surfaces in the absence of latent heat release due to phase changes of water. The vertical motion of an air parcel can be easily diagnosed from its motion along the isentropic surface and as a meteorologist, this is something you really want to know.
Conveyor Belt Conceptual Model
Weather gets simpler when one applies these simple isentropic ideas to the Conveyor Belt Conceptual Model. Weather is much more of a creative ballet with this trio of air flow dancers than a battle. The WCB, DCB and CCB play a part in every weather system and I will introduce these cast members soon. My ongoing thanks to the COMET program for their support and encouragement!

Weather can be really beautiful. This is where I have been heading all along! Art and science merges.

Warmest regards,
Phil the Forecaster Chadwick


Tuesday, March 17, 2020

Blue Sky Blues

#1260 “Three Degrees” Pixels Link
Having introduced deformation zones, it is important to talk about those other lines in the sky. These non-deformation zone lines are completely unnatural. I called this post "Blue Sky Blues" but I could have called it "The Three Degrees of Aircraft Pollution". I thought about this post decades ago but it came to the forefront in 2012  as I painted number 1260 in my artistic journey. I was standing on the Singleton shore and the idea of "Three Degrees" came to me as I painted. That title might sound cryptic. Let me explain.
#1260 “Three Degrees” Laying in the composition
All air traffic was grounded over North America for three or four days after the terror attacks of 911 on September 11th, 2001. I was canoeing at the Frost Centre at the time. My wife and I did notice something unusual - it was really quiet and there were no planes in the sky.

 A couple of curious meteorologists investigated the impact of grounding those aircraft. They discovered that the skies were much clearer and that temperatures responded correspondingly. The most noticeable direct effect was that night time temperatures under clear skies dropped on average three (maybe four) degrees Fahrenheit below the averages established prior to 911. The infra-red radiation from the ground on those nights was not intercepted by the jet contrails and returned to earth. Simply, the nights were clearer and cooler with no air traffic and no contrail pollution. Here is the title of that research “Impact of unusually clear weather on United States daily temperature range following 9/11/2001" by Adam J. Kalkstein*, Robert C. Balling Jr of the Department of Geography, Arizona State University, Tempe, Arizona 85287-0104, USA.

There was a follow-up article that claimed that the investigators did not correctly include the effects of a warm-front in their calculations. That may or may not be the case but any reasonable observer cannot deny the impacts of pollution. Corporations that profit from the burning of fossil fuels spend millions (typically about $201 million every year) to delay and block policies to tackle climate change. The goal is to discredit research that studies the impacts of greenhouse gases and climate change. Confuse, complicate and contradict the basic science that has been well known since the 1820’s. These despicable tactics are sadly quite effective and encourage inaction and ongoing profiteering. An informed and knowledgeable populace is the solution and the thrust of these ongoing efforts. 
Still composing with a fresh contrail being laid down.
Anthropogenic contrails are man-made cirrus cloud formed when water vapour from the exhaust of a jet engine condenses on particles which can come from either the surrounding atmosphere or the effluent itself. The aircraft soot from combustion is comprised of tiny particles which make for efficient condensation nuclei. The water vapour freezes into ice crystals on the soot leaving a visible trail behind the aircraft. 

Any linear “veil clouds” that last more than 10 minutes behind the aircraft are called “persistent contrails”. These long lasting bands of ice crystals diffuse outward with time and have become better known as “contrail cirrus” being indistinguishable from naturally produced ice cloud. In fact the lines can spread into sheets composed of sub visible ice crystals that make the sky appear more grey. These blankets of ice crystals interfere with the escape of infra-red radiation from the earth surface. The distortion of this radiation balance generates a net warming at the surface. 

Scientists have been experimenting with artificial clouds for decades. Indeed weather modification has been attempted since the first time rain fell on somebody’s parade. The seeding of individual clouds to encourage convective rain or to reduce the size of hail can have impact but the requirements in energy and material to do so are typically prohibitive. Meanwhile the climate engineering experiment of global warming has been underway since the industrial revolution first spewed fossil fuel exhaust into the atmosphere in 1760. The accumulated pollution over the years has changed the globe. 

Relatively cheap, fast and generally safe air travel continues to increase by about 4 to 6 percent a year. Market factors can influence this but contrails are certainly increasing and I witness that fact in the skies that I paint. The International Civil Aviation Organization (ICAO) is a United Nations (UN) specialized agency established in 1944 to manage the administration and governance of the Convention on International Civil Aviation. The ICAO Annual Report for 2014 included the following graphic which shows air traffic increasing at about 6% a year. 
ICAO Report 2014
There is a price to be paid for this high level atmospheric pollution. Unless we act, that expense will be felt by and paid for by future generations. Shame.

Contrails influence more than just the colour of the sky and the lives of sky gazers like astronomers, meteorologists and artists. Solar power generation and agriculture feel the impacts immediately.
A typical contrail filled sky drops my solar generation by about 10 percent – which is en par with other solar power studies completed around the globe. 

Agricultural research has measured the “one percent rule”. Crops and vegetation respond to a one percent increase or decrease of solar radiation with an equal impact on growth and productivity. A study in Holland has measured this relationship as being between 0.5 and 1.0 with most results skewed toward 1.0. 

Most flights are during the day when solar power is generated and plants rely on photosynthesis. Contrails quietly threaten a staggering impact on the green circular economy. 
Nasa EOSDIS France 29 December 2019 Typical Contrails
Peter Bosman, a friend in the Netherlands has been studying the impacts of contrails and has prepared a documentary on the topic. A preview of his work is available here (https://vimeo.com/396514411). Using EODIS Nasa Data, Peter found that 50% of the days in the past four years had contrails while about 30-35 days per year had extreme contrail coverage. 

As I watch and try to better understand the skies and the weather, I continue to be disappointed at how much cloud is actually man-made pollution. Jet contrails account for a large percentage of the ice crystals in the upper atmosphere. What should be blue skies with a ridge of high pressure are almost always tainted by jet contrails spreading out with the winds aloft. The blue skies become transformed into overcast thin jet cirrostratus.
Completed under Contrail Skies on the Singleton Shore
This painting view looking westward from the shore of Singleton Lake is a typical ridge of high pressure. I think that all of the cirrus clouds in this painting are the results of jets flying in and out of Pearson International in Toronto. There were three main contrails in this particular painting when I started which contributed to the title I picked. Several jets left fresh scars on the sky while I painted. I included just one of these contrails coming from Europe along the preferred great circle route. The higher contrail cast a shadow on the lower layer of cirrostratus.

So if I am ever given the "third degree" on why I painted "Three Degrees", this will be my answer and I am sticking to it. It is a bit of science mixed with climate change and art. And it is all true.

Warmest regards,
Phil the Forecaster


Tuesday, March 10, 2020

A Closer Look at Lines in the Sky

#1538 "A longer Reach" Pixels Link
If you are lucky enough to witness a long straight line in the atmosphere, you are seeing a deformation zone. In fact every line in the atmosphere that is not a jet contrail, must be a deformation zone. Deformation zones are very common indeed!

The conceptual model of a straight line deformation zone is pictured. Together the two green arrows pointing away from the central col at "C"  along the axis of dilatation, form the deformation zone. The yellow puffs of wind blowing toward the col along the axis of contraction help to drive the rotational components of the deformation zone. This simple graphic is flat and does not reveal the three dimensional circulations that make every deformation zone line so very interesting.

As shown in the first post in this series "Cloud Shapes and Lines in the Atmosphere", the deformation zone is created by two opposing puffs of air.

In the next post "The Theory of Unified Swirls"… a puff of air was shown to create a three dimensional smoke or vorticity ring. The rotation associated with these two opposing puffs shape the linear deformation zone. A straight line deformation zone is created by perfectly balanced opposing flows which can be stationary in the earth frame of reference.

The X in the middle of the graphic represents the puff blowing into the page. Red colours are used for a upward pointing thumb and blue colours are where your thumb is pointing down. 

In the conceptual model of the deformation zone the companion rotations on either side of the inward puff along the axis of contraction are part of the same smoke ring. I would need a three-dimensional graphic to include the vorticity ring but it is important to imagine it in your mind. What happens to one companion rotation must also happen to its buddy as both are created and driven by the same puff of air.
If the puff of wind blowing into the deformation zone is stronger than the puff on the other side, the following bow-shaped deformation zone must result. The stronger puff creates a more vigourous smoke ring and the cross-section though that ring reveals faster and larger companion vortices.

A convex DZ is bowed in the direction of the stronger flow. A bowed deformation zone cannot be stationary in the earth frame but must translate in the direction of that flow. This is by far the most common shape for a deformation zone in the atmosphere. The side with the stronger wind puff is also more likely to be moist than the other. This contrast makes the deformation zone visible. Air is always going somewhere in an attempt to maintain a balance of heat and moisture around the globe. We call this weather. Perhaps an animation might make these concepts more clear.


There are deformation zones in the sky every day. Watch the cloud along the linear edge for a few minutes to determine which way it is moving. The tracer moisture will be stretched along the deformation zone in that direction. The cloud will always be stretched away from the col in the deformation zone conceptual model. By locating the col relative to your position then you can infer which part of the deformation zone is about to pass over your region.

For example, as you look toward the deformation zone line, if that cloud is moving to your right then the col is to your left. Using your right hand and directing your fingers in the direction of the cloud movement would have your thumb point upward. The red vorticity maximum is likely to cross your location. That means more weather compared to what is on the other side of the col.

Typically the deformation zone is part of the large conveyor belt conceptual model of mid latitude storms and that is where we are headed... soon but not today...

Know the wind, know the clouds and that means you will know the weather.

Phil the Forecaster

Saturday, March 7, 2020

A Closer Look at Rotational Clouds

#1908 "Cirrious Stories" Pixels Link
To better understand clouds, one just needs their right hand, your imagination and some time.

Wind shear is required to make the fastest swirls and we know that those curls must be translating in the atmospheric frame of reference. This also means they must be moving with respect to the earth. If you watch the cloud move, one can determine the direction of the wind shear in just a few minutes. Remember that moisture is required to trace the movement of the wind over time. The same movement of air occurs with or without tracer moisture. Clouds are just the integral of the motion of that moisture over time.

Now follow the cloud edge in the same direction that the clouds are moving. If you can see the entire curl, you will reach the cusp which is the end of that line. Using your right hand, align your fingers in the same way that the cloud edge curls. If your thumb point upward then that is a vorticity maximum in meteorologist jargon. If your thumb is point down then that is a vorticity minimum swirl. It is very instructive to know which when you apply the deformation zone conceptual model.  It does not matter which of the cloud edges you follow to reach the cusp at the end of the curl – both cloud edges must curl the same way.

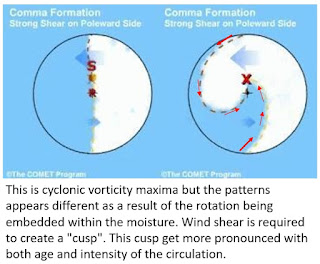
If the moisture used as a tracer for the rotation is originally located on the outer fringe of the rotation, the point of inflection of the two cloud arcs  will be bordered by clear skies. I called this abrupt point of inflection an "outward cusp". This pattern is by far the most common and occurs frequently on the pole-ward side of the jet stream.


If the centre of rotation is actually within the moisture,  the point of inflection of the two cloud arcs  will be bordered by cloudy skies. I called this point of inflection an inward cusp.  Some drawings are worth thousands of words and will help to make this clearer.


These cloud patterns look different only because of where the moisture is being drawn from. If you mentally switch the white cloud to the blue clear sky in either of the patterns, you will achieve the other pattern. Similarly the mirror reflection of a cyclonic rotation is an anticyclonic rotation and that is how I quickly made all of my instructional graphics. Swirls really are that simple whether you call them rotation or vorticity centres.

Looking back to the early 1980's when I first started playing these mental meteorological games (mainly on midnight shifts), this all seems so simple now. At the time, it was anything but clear - the solution was very cloudy in fact ... and there was a lot of push back.

Without the support of the COMET Program and my friends in Boulder, Colorado, this research might never have extended beyond my own meteorological and artistic applications. This research is available through the COMET program around the world for free through enjoyable, entertaining and interactive on-line training sessions. http://www.comet.ucar.edu/

The Satellite Palette Flash Screen circa 2005
For me it was a fusion of science and art and I branded these sessions as the “Satellite Palette”. The colours on my artistic palette were replaced by the conceptual models that could be creatively applied to any weather situation to better understand and solve the forecast problem of the day.

In the next post we will revisit the all important line in the sky. The deformation zone was described in terms of a decrease of the wind in the very first post "Cloud Shapes and Lines in the Atmosphere".
The deformation zone can also be diagnosed in terms of the four swirls that shape that line.

Warmest regards,
Phil the Forecaster


Tuesday, March 3, 2020

The Theory of Unified Swirls

#1717 "Sunset Waves Nite" Pixels Link
Every profession has its own jargon but I will try to refrain from the practice. Swirls are call vorticity by meteorologists. A swirl is simply a rotation. In the second post of this series I explained that Rotation is the Key to Unlock Cloud Shapes. In the third post Cloud Shapes from Rotation, I described how cyclonic rotation shapes clouds. The moisture patterns that result tell you about the nature of the swirl itself.

Everything is simpler from the atmospheric point of view.  We may not live in the clouds and the atmospheric frame of reference but we can imagine. I am about to make cloud swirls and shapes even simpler and the answer was blowing in the wind all of the time. I hinted at the meaning of life in the very first post Cloud Shapes and Lines in the Atmosphere and to some, what follows may be life changing. You will be able to view clouds from both sides now just like Joni (Mitchell).

I will credit Bob Dylan with this discovery even though he was just blowing smoke. Here Bob is blowing a substandard smoke ring but it is the thought that counts.
Smoke rings are created from a quick puff of wind, near circular lips and some tracer to reveal the resultant air circulations. I am not a smoker so have never done this first hand. The puff of wind creates speed shear. Speed shear must move in the earth frame of reference which is why smoke rings are never stationary. In a flat display, meteorologists could analyze a smoke ring cross-section as follows below.


Looking in the direction of the puff, the speed shear must create a cyclonic swirl to the left and a complimentary, companion anticyclonic swirl to the right. Cyclonic rotation is associated with upward motion in the atmosphere. Anticyclonic rotation is a downer. The illustrated right hand rule will help you remember up and down. Meteorologists have treated cyclonic and anticyclonic swirls as different entities. They are not. Let me explain...

First let’s talk about the atmosphere. The atmosphere as pictured is relatively shallow. The atmosphere has a thickness comparable to the skin of an apple - more or less. Actually 99% of the atmosphere is found within 30 km of the earth’s surface. The earth’s radius is about 6400 km so the atmospheric layer is only 0.5% of the earth’s radius. That’s shallow! 

Early meteorologists concentrated on the horizontal motions in the atmosphere. Our observations were only from the surface. The paper weather maps were flat. That is all we had. How can anything so flat have any important three dimensional patterns? These concepts have led to the separation between cyclonic and anticyclonic swirls. In fact,the interesting part of weather and meteorology occurs in the vertical and we can learn from that smoke ring.

A smoke ring is simply a puff of wind and it is a three dimensional circle of spin. If we look along the same direction as the puff of wind and follow the smoke ring with our right thumb we see that both cyclonic and anticyclonic spin can be found along the same smoke ring. Meteorological convention has just separated this single, simple physical phenomena into two separate branches through only considering the horizontal cross-section. The smoke or moisture patterns across the ring are mirror reflections of each other. The smoker has learned to concentrate the smoke into tightly wound vortices.  All one needs is a puff of breath and practice.

The smoke ring and swirls are larger and stronger with a stronger increase in the speed of the puff. As the vorticity maximum or swirl to the left of the straight line puff increases, the vorticity minimum must also increase correspondingly. I called these companion circulations – what happens to one swirl must also happen to its buddy swirl. Swirls also need closure – either back on itself or on a surface. That’s just the way it is… more on this in another post.

The take home message is to remember the smoke ring in the atmospheric frame of reference. Always envision a three dimensional ring even though the flat paper might can only depict cyclonic and anticyclonic swirls. To really understand the atmosphere we need to remain in the three dimensional atmospheric frame. In the atmospheric frame, everything is much simpler to understand. A smoke ring is just one half of the deformation zone conceptual model illustrated in the very first post Cloud Shapes and Lines in the Atmosphere.
And that is how you can make a line out of rotation....

In 1985 when I started teaching this in the Training Branch of Environment Canada, I tried different approaches and diverse graphics to try to connect with the students. Everyone learns differently. I may have failed but I never gave up. Sooner or later, one of these attempts would work and open the atmospheric world to them.

I spent a lot of time thinking about and painting clouds to come up with these simple truths. Sometimes the simplest things are the hardest to imagine. Maybe I was trying too hard and over-complicating things. Maybe I was just slow…

There is more to come...

Phil the Forecaster