 |
| #1906 "Sunrise Freezing Rain Deformation Zone" Looking East |
Sometimes it is best just to enjoy and paint the weather. I often do only that. The above painting includes gravity waves and deformation zone chains along a warm conveyor belt but I was focussed more on the shapes and the colours. I painted what I saw. Each line does indeed tell a story but it can get complicated even using your Coriolis Hand. You need to know which way is north and which lines are the regular gravity waves perpendicular to the wind and which are confluent asymptotes paralleling the atmospheric frame flows. This will not be on any exam... just enjoy the weather and the beauty of nature. As described in "The Nature Fix" by Florence Williams (2018), it is good your you. The science is always easier from the bird's eye satellite view of the weather.
 Warming wind shear and the double-cyclonic deformation zone pattern are probably the most important concepts to weather watchers. Warm and moist air being moved northward is the source of the weather that we observe and forecast in the mid and higher latitudes. The graphic for the idealized, double-cyclonic deformation zone chain was made by my COMET friends in Boulder, Colorado. This two dimensional graphic does a pretty good job at portraying what happens in the actual three dimensional atmosphere. Remember that with a warming wind, only the cyclonic swirls are enhanced.
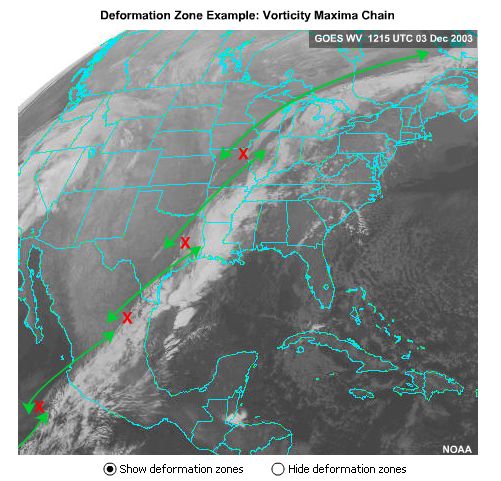
 A chain of deformation zones can be quickly sketched between a series of vorticity maxima (cyclonic swirls and the red "X's") along a channeled jet. As a result of the wave nature of the atmosphere, subtle vorticity maxima can be inferred at regular intervals even if the corresponding satellite signature is inconclusive.

The previous two blogs about thermal advections and dynamically changing the shape of the deformation zone, have been a bit heavy for light reading. The posts developed these conceptual models from first principles using only your Coriolis Hand, your imagination and thought experiments. That is exactly how they were developed on night shifts in the weather centre. The mental images playing in my mind where the same in the satellite imagery that I was using to discover the forecast problem of the day.

Vorticity maxima chains are typically located between the bottom of the upper trough and the downstream point of inflection (the black circle in the following graphic) where the cyclonic curvature of the trough changes to the anticyclonic curvature of the downstream ridge. Analysis of these chains is best achieved by locating poleward "bumps" in the axis of maximum winds and the cloud patterns. The lines of moisture will reveal "backward s" shaped deformation zones between the vorticity maxima in the chain.

The satellite example was from 2003 but such a pattern happens almost every day. Your Coriolis Hand with your thumb pointing upward at every red “X” will reveal the sense of the rotation. If you are looking for weather, be it enhanced cloud or precipitation, look just downstream from each red “X” which move at about a half of the speed of the atmospheric winds – typically toward the northeast.
Every line in the sky has a tale to tell. I spent countless hours deciphering what the atmosphere had to say and I am happy to share those stories here.
Keep you paddle in the water and warmest regards... stay safe,
Phil the Forecaster Chadwick
2 comments:
A good refresher, Phil!
Is there a relationship between the magnitude of the vort max and the size of the 'bump' in the cloud pattern?
I still think of you every time I see a def zone ;-)
Take care.
Thanks Dave. For sure, the size of the pattern is related to the amount of angular momentum within the flow - but the growth of the pattern relies greatly on the instability in the cyclonic companion and how much latent heat energy can be release to stretch the vorticity tube. I remember early in this work watching a small curl protrude from under the cirrus deck. That was the first clue that the energy was even there... within 12 hours it was a major storm aided by convection and energy transformations. The NWP in those days would miss convective initiation (and probably still does). My job ws to convince the others on shift that this little bump in the AC cloud shield was important. :>)) Thanks for taking the time to read it Dave. There are about 36 such posts now and I have another 20 or so to go before I will be content.
Post a Comment