Monday, October 25, 2021

Sunrise or Sunset - Seeing Even More Gravity Wave Clouds

#2521 "Singleton Sunrise Morning Cloud"

Perhaps my years of paddling and walking on shorelines, not to mention "sitting on the rocks of the bay", have paid off in many more ways than just the enjoyment of the moment. You can learn a lot by watching waves. Gravity waves are the ultimate tool because they are absolutely perpendicular to the atmospheric frame of reference wind. I painted gravity waves in the above skyscape and this Blog will explain those as well as the patterns in August sunrise at Killbear that initiated this series of Blogs on Creative Scene Investigation. Please read on... 

Early satellite imagery of the weather from the seventies was the other key inspiration for me. I saw that atmosphere as an ocean of air very much like the lakes that I paddled on.  That statement is not a big stretch because it is true. The different air masses are also individual pools in that larger ocean. We just happen to live at the bottom of those air oceans. 

I applied the concepts of the different types of water gravity waves to the atmospheric fluid of air so that I could better appreciate the satellite imagery. There may be seven different types of ocean waves but I found it most helpful to keep it simple and just consider wind waves and swells. 

Wind-driven waves are created by the friction between wind and the surface water. As wind blows across the fetch of the water, the continual disturbance creates a wave crest. Gravity takes over from the wave crest and digs the trough. Wave height and wavelength both increase with the wind speed. 

Swells may originate as wind waves but continue propagating far from the original energy source of the strong winds. Shorter wavelength swells carry less energy and dissipate faster. Swells that are observable some distance from the source tend to be longer wavelengths. 

In my graphic for #2535 "Sunrise on Killbear Light", I conveniently labelled the main, large bands of cloud as simply gravity waves. I did not call them "swells" or mention the fine structure of the clouds within those atmospheric swells.  Let me explain... 

Swell Gravity Waves at a distance
from the strong wind source region
Atmospheric wind waves are generated where the atmospheric relative winds are strongest - between the companion swirls. This is also the local maximum in the jet stream. Atmospheric wind waves can be seen in the cirrus. As in the ocean, atmospheric swells propagate outward from this source. The shortest wavelength swells decay fastest. The longer wavelength swells travel great distances before "crashing" on the shore of the air mass at the deformation zone. If you can imagine the atmosphere in these terms, much of the science of oceanography can be transferred to the atmosphere. It all started when I first really began  to appreciate satellite imagery. 

In Sunrise or Sunset - Seeing Gravity Wave Clouds, I was actually describing atmospheric swells. What I did not describe were the details within those swells and how they got there. The CSI fun really starts with superimposing smaller scale wind waves on to the atmospheric swells. The signatures that result can be applied to really understand the weather. I constructed the following graphics to better explain these patterns thinking that each image might be worth a thousand words. 
Adding Wind Gravity Waves to Swells

Atmospheric gravity waves are most easily observed when the layer of moisture in the stable layer is rather thin. The crest of the wave associated with ascent and cooling air is more likely to be cloudy - condensed water droplets or ice crystals. The lowest point of a wave or trough associated with descending and warming air will be the thinnest. The best case is when the lifted condensation level in the atmosphere is near the midpoint between the crest and trough so that bands of cloud are separated by blue sky. Waves are occurring all of the time in the atmosphere but those motions are typically shrouded in cloud. 

There are many interesting situations that superimpose wind gravity waves on top of swells. The warm conveyor belt is probably the most interesting and informative about the weather. The system relative winds associated with the warm conveyor belt are best described by the deformation zone conceptual model but I will save most of those details for the next Blog and focus instead on the gravity of the situation. 

The wavelength of the wind waves is determined by the wind speed – stronger wind gives a longer wavelength.  The spacing of different portions of the wind wave are best described by differences in the wind speed which translate to differences in the wavelength. The simpler approach is to imagine that the stronger winds along the confluent asymptotes are simply tipping the gravity waves as depicted in the above graphic. That simplification is not correct. 

As a home study assignment, drop a pebble in a pond or your bathtub to really learn about dispersive swell waves. All of the energy in that first wave is supplied by the stone. The waves disperse in all directions from that source and significant ripples survive long distances before dissipating. … with no additional energy supplied. These are really swell swells! The direction of motion of dispersive swells like in your tub, might be diagnosed by the decay in amplitude, the arc shape of the swell or in the atmosphere, the direction of cloud drift.

We should not be surprised to see smaller and shorter wind waves superimposed on swells. They happen all the time in the atmospheric ocean.

Remember that nature's solutions to the laws of physics is always correct. Nature also constructs more accurate and beautiful graphics than I can. The next Blog will further explain gravity waves (both wind driven and swells) within the context of the deformation zone conceptual model. Stay tuned, looking at clouds is about to get even more exciting. I am sittin' on the very edge of that rock of the bay.. Otis Redding would be pleased. 

Keep you paddle in the water and warmest regards... 

Phil the Forecaster Chadwick

Tuesday, October 19, 2021

Sunrise or Sunset - Seeing Gravity Wave Clouds

#2535 "Sunrise on Killbear Light"

This is the next step in applying Creative Scene Investigation (CSI-ing) to "Sunrise on the Killbear Jumping Rocks". The first step explained the colour of the light in Sunrise or Sunset - Seeing Red. The second step explained the clouds. The next step will investigate the gravity waves in those clouds using #2535 "Sunrise on Killbear Light" since that painting includes that portion of the sky depicts the same sunrise, . 

#2534 "Sunrise on the Killbear Jumping Rocks"

Every line in the clouds has a story to tell. The large scale banding in these clouds are gravity waves and they reveal the system relative winds in the free atmosphere away from friction and complicating interactions with the surface of the Earth.  The larger the wavelengths of the gravity waves, the stronger the wind. The system relative wind direction must be perpendicular to those waves. The cloud itself is probably drifting in the same direction as those winds but one cannot discern that motion in a painting. 

The sky in #2535 "Sunrise on Killbear Light" is the same as in
#2534 "Sunrise on the Killbear Jumping Rocks" but I
included more of the clouds in that painting ... so the weather
can be better understood. 

Gravity waves in the sky are exactly like gravity waves on a lake. The wind is blowing perpendicular to those lines. The layer is fairly stable. Waves increase in size and wavelength with the wind. Parcels of air or water deflected upward are pulled back down by gravity. These parcels have momentum and overshoot the average level on their way down. The sinking parcels reach equilibrium and then rise buoyantly. The parcels once again gain momentum and overshoot the average only to be pulled down again by gravity. The process gets repeated again and again and again...

The fact that there are clouds at all tips the balance in favour of that being a southerly wind with moisture from the tropics. If there is not much cloud, then it is likely that the winds are from the north were moisture is more limited. 

The gravity waves also reveal the relatively stable layer in the atmosphere. Parcels displaced from the stable level, always try to return home again. These stable layers can be frontal surfaces typically associated with a southerly flow and more cloud - a warm front in this case. Subsidence inversions are stable layers that typically occur with sinking air and are typical with dry northerly flows. 

Dry northerly flow with gravity waves. A sunset
view looking west over Singleton Lake. 

But there is much more to CSI in this painting … I also see deformation zones and smaller scale gravity waves but will save those for the next day.

Keep you paddle in the water and warmest regards... 

Phil the Forecaster Chadwick

Wednesday, October 13, 2021

Sunrise or Sunset - Seeing Clouds

This is the next step in applying Creative Scene Investigation (CSI-ing) to "Sunrise on the Killbear Jumping Rocks". The first step explained the colour of the light in Sunrise or Sunset - Seeing Red

2518 "Sunset Weather Story"
Another sky with lots of cloud...

Air moves like most everything else following the path of least resistance. Air can move along constant energy surfaces in the atmosphere for free… meteorologists call them isentropic surfaces. These isentropic surfaces slope upward from the equator toward the poles. For air headed northward (in the northern hemisphere), the parcels of air rise for free along those sloped surfaces. These parcels of air from the lower levels of the tropics are loaded with moisture. Clouds form as the air rises and cools. For someone in the mid latitudes, the high level cirrus arrives first to be followed by the mid level altostatus and eventually the low cloud nimbostratus if it is raining. More on clouds in a later Blog... 

The air originating from the Arctic tends to be dry and cold as the parcels start of their southward journey. These parcels become warmer and drier as they descent along the downward sloping isentropic surfaces. Typically not much cloud to see in those southbound flows. For more on isentropic science see 'Isentropic Surfaces - Science and Art Merges'.

You might imagine yourself as a kid with your arms extended along the slope of the isentropic surfaces. With your right hand down and your left hand up, the slope of your arms would be the same as the slope of the isentropic surfaces if you are looking east. You can even make noises and imagine you are an airplane... 

2534 "Sunrise on the Killbear Jumping Rocks"
There is a lot of cloud in this painting. Ice crystal cirrus clouds are overhead with lower level altostratus on the right side horizon. This cloud was painted in more detail in #2536 "Killbear Cirrus Sunrise" . Applying what we just learned, the rising southerly flow full of cloud must be originating from the south. Pointing my right hand down and to the south means that you must be looking eastward in the painting. Those cloudy air parcels are rising on the isentropic surfaces as though they were riding up your extended arms. I saw the sun so it must be dawn and that yellow ball of light was rising. 

But there is much more to CSI in this painting … for another day.

Keep you paddle in the water and warmest regards... 

Phil the Forecaster Chadwick

Tuesday, October 5, 2021

Sunrise or Sunset

#2516 "Singleton Dry Cold Front Sunset"

Sometimes it is a challenge to determine which rays of sunlight inspired a work of art. This explains why I typically include the answer in the name of the painting (like above). But there are ways to decipher the puzzle and this is the first in the series of Creative Scene Investigative methods that I employ. I will keep these brief. 

Colour is king. Humans can see maybe up to a million colours. Our brain takes that information and make sense out of it - perception. We perceive things automatically which is why many people thought my sunrise painting below was actually a sunset. They saw "red" and instinctively knew what that meant. 

#2534 "Sunrise on the Killbear Jumping Rocks"

Typically sunset are more colourful than sunrises. Dust and particles raised by stronger daytime winds and convective thermals created when the sun heats the earth, are efficient at scattering the shorter wavelengths of light out of the direct white beam originating from the sun. Removing the shorter blue, and green light leaves more orange and red to be viewed. Therefore it is automatic to think that red skies must be sunset skies. 


Vertically Integrated Smoke Plume July 20th, 2021
The skies have been especially colourful this past year. Forest fires over the Rockies and throughout the Boreal forest are now much more common - a result of climate change. This smoke has spread throughout eastern North America and is the reason my sunrise sky was remarkable for its hues of red and orange. Colourful skies are the new normal. 

Red skies have been painted before. Tom Thomson's skyscapes starting in the fall of 1915 were especially colourful. His friends in the Group of Seven thought he was taking too much artistic license and exaggerating those hues. Tom painted what he saw and in this case, he was seeing the volcanic dust and the aerosols from the eruption of Lassen Peak in California. Norwegian artist Edvard Munch painted what became known as "The Scream" in 1893 possibly remembering the colour of the skies after Krakatoa exploded a decade earlier in 1883-84.  Some refer to this as the scream of nature and I would not disagree. Nature is screaming now as well. 

There are other clues painted in those oils of Killbear that reveal the eastward looking view. Those will be revealed in time... 

Keep you paddle in the water and warmest regards... 

Phil the Forecaster Chadwick

Sunday, October 3, 2021

Creative Scene Investigation

 My Professor recently asked me a question: "I notice that the title is "sunrise". Interesting. A meteorological question for you. Can an ordinary person or even a professional meteorologist discern sunset from sunrise in art? And if so, how? To me, this is a 'perfect' sunset painting."

#2534 "Sunrise on the Killbear Jumping Rocks"

I am honoured to provide an answer for my Professor and friend. I have thought about these things an inordinate amount of time. Perhaps I have always had my head in the clouds and for me, that has been a good thing. Nature and the real atmosphere have been valuable classrooms for me - as much as the fine  universities I have attended. When en plein air and surrounded by the everyday world, I simply observe and questions appear. Possible explanations drift through my consciousness and play like movies in my mind. 

I have compiled the answers to those questions into a body of work that I call Creative Scene Investigation. CSI is not to be confused with the TV show of a similar title. Nobody dies. The laws of science are something that you can put your faith in. They are not subject to the whims of humans. We are not moving at the speed of light so there is no need to invoke Einstein's Special or General Relativity Theories. 

I developed and validated these CSI concepts using my own paintings - fully aware of the time, location and direction of view of  each work. I have kept detailed records from the very start of my artistic journey in 1967. It is quite a library of art that now comprises 2559 paintings. My Fine Art America site includes about 2000 of those works. 

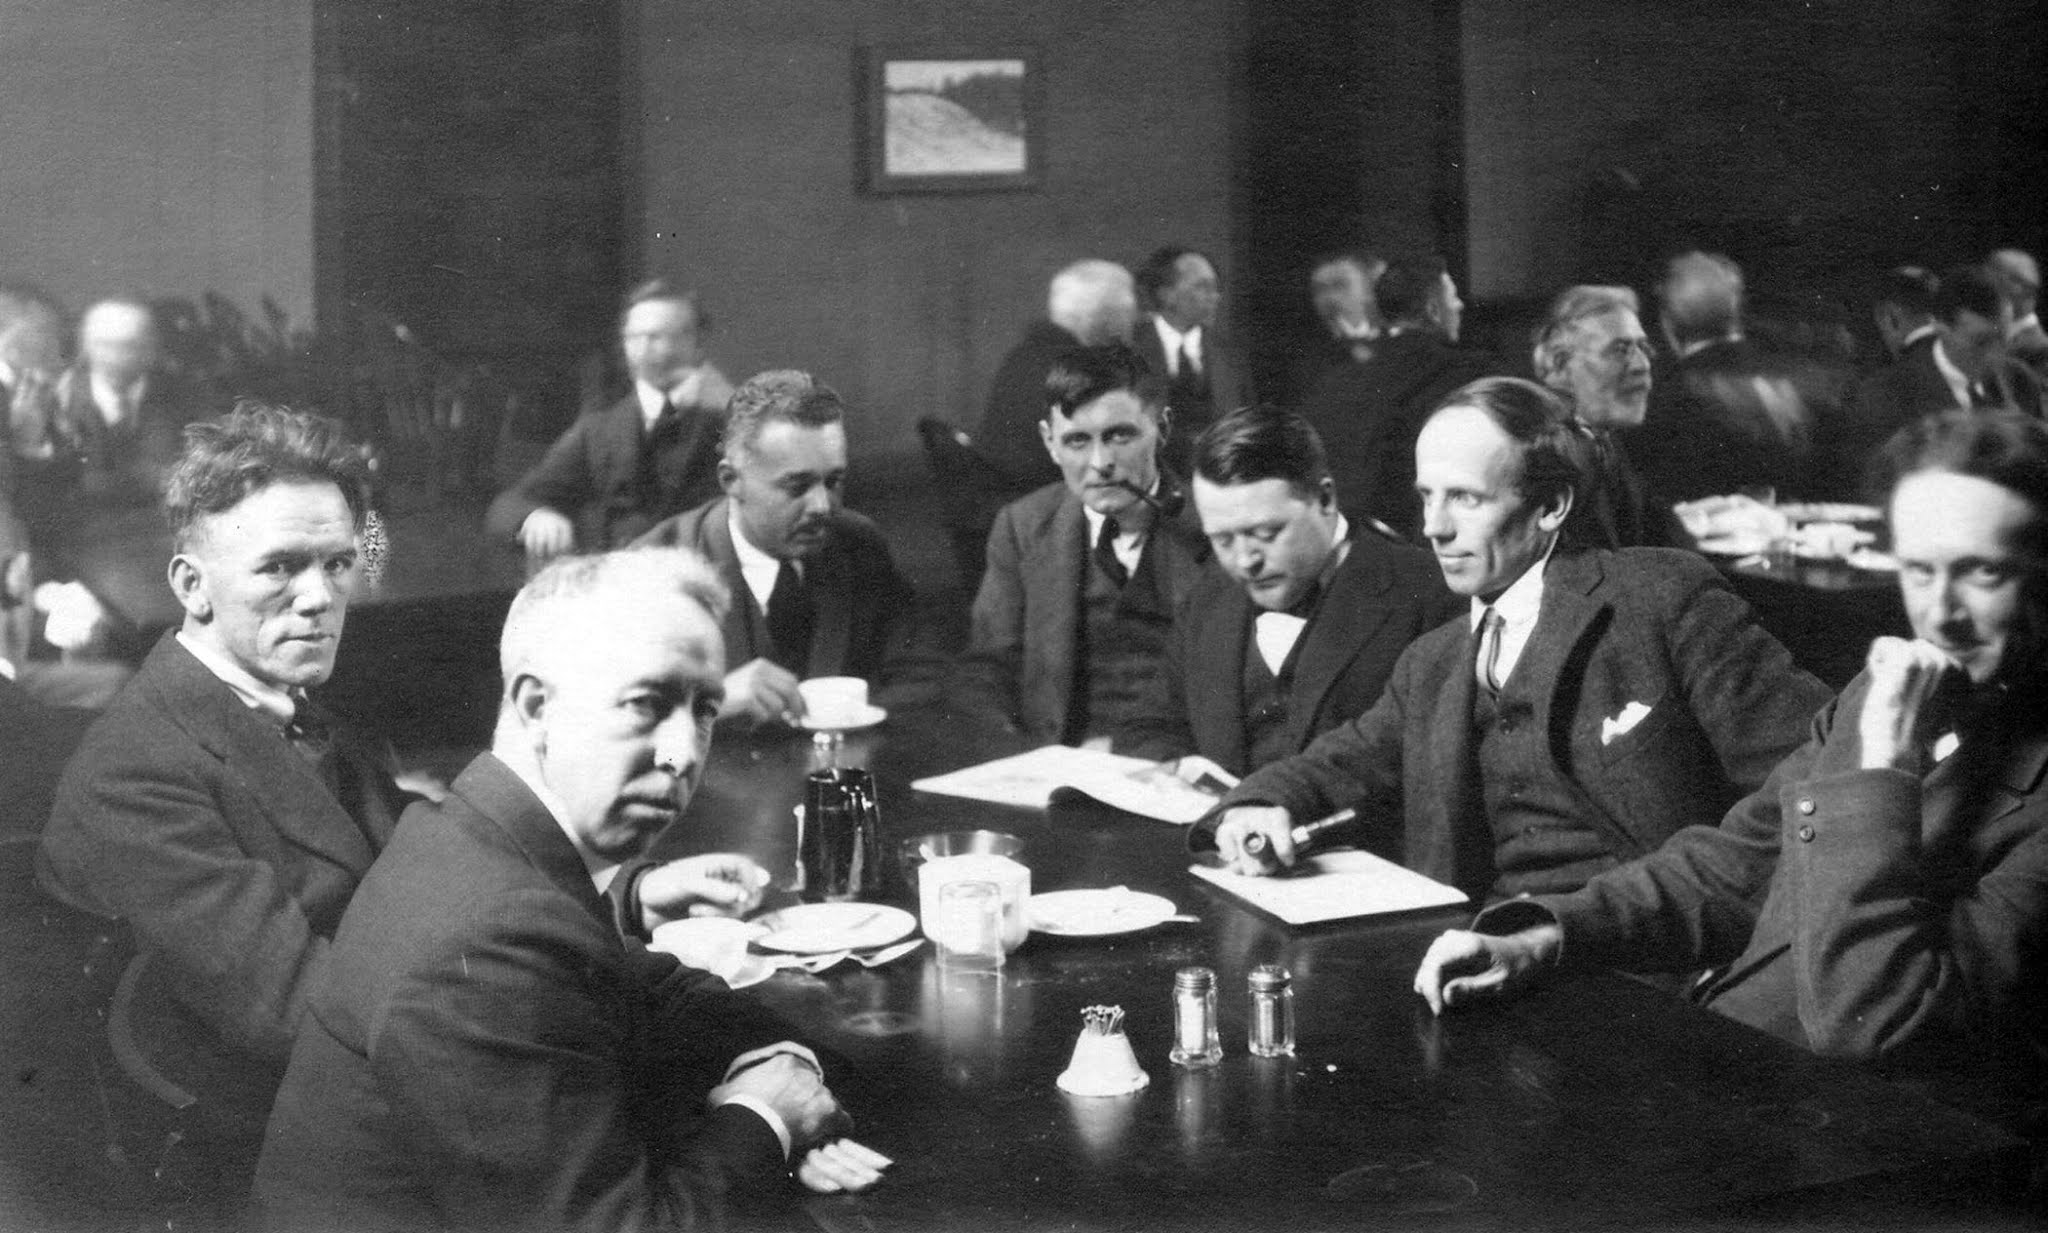
The Group of Seven
with Barker Fairley (fourth from left),
Arts and Letters Club, Toronto, 1920.
I then validated these CSI principles on an independent sample. Tom Thomson and the Group of Seven really loved to paint en plein air and they greatly inspired my artistic ramblings as well. Tom and the Group faithfully observed, recorded and interpreted the honesty of nature that inspired them.  They included enough clues in their work that I was able to apply CSI and appreciate the subjects that caught their eye. It was as if I was standing with them and appreciating the same views of nature while they painted. 

This effort morphed into a series of presentations that I started to give in the mid 1980's. The talks went by various names and have been presented across Canada whenever and wherever there was a group who was passionate about these artists, understanding the beauty of nature and wondering "why" they painted. Googling "Tom Thomson Was a Weatherman" will turn up the details of a few of those events. I wrote a book with that title but the publishers were not interested. 

CSI involves the close examination of the art and applying the appropriate bits of science to whatever might be included in the painting. The science might come from climatology, meteorology, atmospheric optics, astronomy, biology, geology - the list goes on and continues to grow. This is not to say that it is impossible to make a mistake – it is just that it helps to really investigate and think about what the artist was contemplating. The more facts that you have that point in a particular direction, the more confident you can be about your conclusion. You could still be wrong but you will learn from that mistake as well. 

CSI tries to answer the Five questions of any good story. 

  • Who is it about?
  • What happened?
  • When did it take place?
  • Where did it take place?
  • Why did it happen?

The first question pretty obvious if we know anything about the artist. CSI really dives deep into answering what, when and where which often reduces to the time of day OR which way is north? Having answered the first four questions allows us to get into the mind of the artist to better understand "why". 

The complete body of work that comprises Creative Scene Investigation is much too long for a single Blog entry but I have decided to mix in more CSI details here. CSI entries will be mixed in with my ongoing Blogs on meteorology and material that did not get published before I officially retired on Groundhog Day in 2011. One never fully retires...

Here are a few of the CSI applications that I will explain in more detail. 

The clouds and weather are my favourite place to start CSI. What is the cloud type and height? Is the atmosphere stable or unstable? Are the clouds frontlit or backlit?  What is the wind direction at cloud height from the cloud shape? What is the relative wind speed? Where is the sun? What is the time? What is the season? What is the angle of view? There are many questions and each painting might ask a few more that are not included in the summary. 

Finally, I apply a bit of knowledge from how artists typically work. If the art is a plein air work, artists tend to paint the colourful side of a subject with the sun on their back. It simply feels good. Painting looking into the sun is hard on your eyes and one is viewing the shadowed side of the subject while developing cataracts. Typically not good. The angle of a plein air artist’s view can be very much like a sundial. 

#2522 "Singleton Sheared ???? Anvil"

This may not be rocket science, brain surgery or even rocket surgery but it is science… and it is fun... Much more to come. 

Keep you paddle in the water and warmest regards... 

Phil the Forecaster Chadwick

Tuesday, June 1, 2021

Success?

#0828 "Standing Outside the Fire"
How do you know if you have succeeded with your art?

The best art grabs you – affects for feelings – your mood. Hopefully in a positive way. There must be an unspoken connection between the artist and the audience. If you have accomplished that even once as an artist, you are on your way. You can do it again. Keep trying.

The art can be almost anything: visual, music, dance, writing … there is a host of creative disciplines that provides the artist with an outlet for expression and maybe even an audience. What excites me is that sometimes those outlets fuse and the sum is greater than the parts. 

Leonardo da Vinci wrote “Painting is poetry that is seen rather than felt, and poetry is painting that is felt rather than seen.”. My friend Marko Burrows has fused Leonardo's concepts and put them to music. 

Marko Burrows, England

Marko Burrows is a one man music machine creating a library of music in much the same way that I create a garage full of art. We are driven to create. My art connected with Marko and he reacted by writing a song… I love it and maybe you will too.

I have his songs on my playlist and I smile whenever their turn comes up. Marko was able to distill my art into the poetry and music of "It's Hot in Here" and "Painting Life". I find it truly remarkable how he actually hit the bullseye of my character. Life and the planet are fragile and we need to become better stewards of both for the sake of nature and the generations yet to come. Great responsibilities must come with the equally great rights and freedoms that we enjoy - paid for by our parents - the Greatest Generation. I do not believe in entitlement - merit is all that matters. Work, effort and learning to be better are important. We are all the same so let's strive together to make the planetary paradise better for those yet to come.  

Here is the poetry of "It's Hot in Here" by Marko Burrows.
  • It’s hot in here 
  • The weather’s weird for this time of year
  • It’s hot in here I’ve been watching steam rising from my beer! 
  • A working man 
  • My rich boss says, “Strip the land” 
  • There ‘ain’t no plan 
  • Just more and more wealth in his hands 
  • I look to the sky, and I’m in awe. 
  • However we change it, it’s so beautiful
  • It’s hot in here 

  • And the world cries! 
  • It doesn’t matter what you’ve done 
  • Like the weather you cross my face 
  • I’ll still be here when you have gone 
  • A very different place 

  • It’s hot in here 
  • Its’ raining more, the sky’s not ever clear
  • It’s hot in here 
  • My car needs oars, it’s the floods fear 
  • I look to the sky, and I’m in awe...
  • However we change it, it’s so beautiful 

  • And the world cries! 
  • It doesn’t matter what you’ve done 
  • Like the weather you cross my face 
  • I’ll still be here when you have gone 
  • A very different place 

  • It’s hot in here 
  • They say the tipping point is awful near
  • It’s hot in here 
  • From this viewpoint it’s our last frontier 
  • A working man, How we stop it I don’t understand 
  • There ‘ain’t no plan. 
  • There’s no-one out there to lend a helping hand 
  • I look to the sky, and I’m in awe. 
  • However we change it, it’s so beautiful 
  • It’s hot in here

Painting Life by Marko Burrows. Marko told me that he was not happy with his voice on "Painting Life" but it is honest and that is enough for me. This is the poetry of music, art and life explained in song. Marko wrote the words and music as inspired by my art. Here are those words. 

  • The paint on my brush keeps on flowing 
  • In small dabs and long strokes it feels right 
  • Blending, colour and texture, that’s going
  • To reflect, almost dance, in the light
  • But up close, you can’t see any structure
  • It’s a jumble of chaos and strife
  • But step back and look at its wholeness
  • A painting is a lot like life

  • You see life through the lens of a camera
  • It’s so sharp and digit’ly bright
  • But the light that you see is so filtered
  • You’re inured to the feelings of life
  • When you look at the light from a canvas
  • Made by Artists, with Brush and a knife
  • You step back and you look at its wholeness
  • A painting’s a lot like life

  • The paint flows, the brush goes
  • The shapes that it forms
  • The knife on my palette
  • And the hue that is born
  • Take what I see, with a little part of me
  • And the painting of life is formed

  • The paint on my brush keeps on flowing
  • In small dabs and long strokes it feels right
  • Blending, colour and texture, that’s going
  • To reflect, almost dance, in the light
  • But up close, you can’t see any structure
  • It’s a jumble of chaos and strife
  • But step back and look at its wholeness
  • A painting is a lot like life
I have lost track of Marko over the past few years. I guess that happens when you make friends over great distances and the linkage is as fragile as the web. 

In my mind, Marko is tremendously successful and I hope that he feels the same. This is for you Marko and I hope that you and your family are safe... best to you my friend... 

Keep you paddle in the water and warmest regards... 
Phil the Forecaster Chadwick


Monday, May 31, 2021

Dancing with the Weather

#1717 "Sunset Waves Nite"

The last couple of years of meteorological blogs can be summarized by creative, body movements – the Weather Dance. I failed at making this mainstream meteorology during my career but I do not give up easily. Perhaps this meteorological approach was too much fun?  I believe that your career should be your passion and that it must be creative and fun. A career can last a lifetime so you might as well enjoy it. You gotta laugh! By using only your Coriolis Hand and the attached arm, we can better understand the conceptual models that depict the Atmospheric Conveyor Belts, the Deformation Zone and even Thermal Advection. I call this approach "Dancing with the Weather". 

The weather is more of a ballet than a battle anyway... Weather is a balancing act that moves forms of energy all around the Globe in order to keep the earth in balance. Sometimes these motions are focussed, magnified and intensely damaging as a result. Supercellular thunderstorms, tornadoes and tropical storms come to mind. Everyone wants to see a tornado before they die... but not just before they die. I have used this line many times during my presentations and never get tired of casting out that hook.  Humans see this extreme weather as break dancing... literally. But all weather dances serve a purpose in moving energy around.

Conveyor Belt Conceptual Model (CBCM)

The Conveyor Belt Conceptual Model (CBCM) is a vital tool required to better understand the weather. Warm air rises as it is moved northward along the isentropic surfaces. Cold air sinks as it is advected toward the south. Water vapour and electrical charge are also added into the mix to make the weather.  This essential conceptual model also employs the deformation zone and thermal advection concepts. If you follow this train of thought to the end of this blog, you are on your way to really understanding the weather around you. 

For a start ... focus on your Coriolis Hand and the attached arm. This is your right hand if you are in the Northern Hemisphere and your left appendage if you are south of the equator (see  “The Solution to Cloud Swirls Can Be Found in Your Hands”). 

Coriolis Hand with
Thumb Pointing Up
If your Coriolis Thumb is pointing upward, your Coriolis arm is oriented like the cyclonic companion of the warm conveyor belt (WCB) of the CBCM. Your elbow will even bend cyclonically. What does this mean for the weather you can expect with the cyclonic companion? The answer is more weather with ascending, moist air. Embedded convection is also likely along the cold front. The following Radar Palette material was initially presented in "The Cold Conveyor Belt - The Weather Wizard Behind the Curtain". The Radar Palette did not get published but it is the equivalent to the Satellite Palette using conventional, Doppler and dual polarized radar to investigate the conceptual models of the atmosphere. 

Weather with the Rising Cyclonic Companion of the WCB


Coriolis Hand withThumb Pointing  Down
If your Coriolis Thumb is pointing down, your Coriolis arm is oriented like the anticyclonic companion of the WCB of the CBCM. Your arm will feel twisted and uncomfortable while in this orientation. Your elbow will not bend comfortably in the anticyclonic direction. The weather with the anticyclonic companion is drier with descending air. 
Weather with the Anticyclonic Companion of the WCB

The Warm Conveyor Belt (WCB) of the Conveyor Belt Conceptual Model (CBCM) is composed on both the cyclonic and anticyclonic companions. Each have their own characteristics as described which define the associated weather. 

The Dry (DCB) and Cold (CCB) conveyor belts are also composed of cyclonic and anticyclonic companions so there are at least six Coriolis arms in the ballet of each and every weather system. These flows would also be shifting with the differential thermal advections as described in "Shifting Winds? Why?". Even the most complex weather situation can be displayed and understood using your Coriolis Arm.  

Imagine the weather dancing going on especially on night shifts, trying to explain the weather patterns witnessed on the satellite imagery. The remote sensing information like satellite and radar revealed the real atmosphere and the actual weather. Trying to explain the Weather Dance was fun, funny and illuminating all at the same time. The following two collages of images are all you really need to remember so that you might better understand the atmosphere and the weather that you witness. 

Cyclonic Coriolis Arm (red for cyclonic)


Anticyclonic Coriolis Arm  (blue for anticyclonic) 

By employing the Conveyor Belt Conceptual Model and your Coriolis Hand,  you can examine and understand the three dimensional nature of the clouds and how they fit together in time and space. It helps if you know which way is north (for the slope of the isentropic surfaces that the conveyor belts follow) but really, you just need to know up from down...

Keep you paddle in the water and warmest regards... stay safe, 

Phil the Forecaster Chadwick
PS... More to come. 

Wednesday, May 26, 2021

Warming Winds and Deformation Zones


#1906 "Sunrise Freezing Rain Deformation Zone"  
Looking East

Sometimes it is best just to enjoy and paint the weather. I often do only that. The above painting includes gravity waves and deformation zone chains along a warm conveyor belt but I was focussed more on the shapes and the colours. I painted what I saw. Each line does indeed tell a story but it can get complicated even using your Coriolis Hand. You need to know which way is north and which lines are the regular gravity waves perpendicular to the wind and which are confluent asymptotes paralleling the atmospheric frame flows. This will not be on any exam... just enjoy the weather and the beauty of nature.  As described in "The Nature Fix" by Florence Williams (2018), it is good your you. The science is always easier from the bird's eye satellite view of the weather. 

The previous two blogs about thermal advections and dynamically changing the shape of the deformation zone, have been a bit heavy for light reading. The posts developed these conceptual models from first principles using only your Coriolis Hand, your imagination and thought experiments. That is exactly how they were developed on night shifts in the weather centre. The mental images playing in my mind where the same in the satellite imagery that I was using to discover the forecast problem of the day.

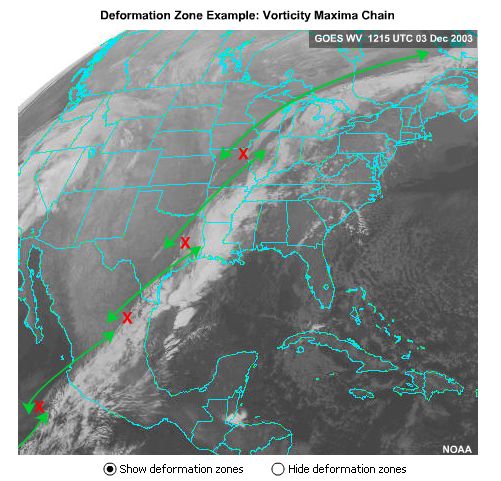
Warming wind shear and the double-cyclonic deformation zone pattern are probably the most important concepts to weather watchers. Warm and moist air being moved northward is the source of the weather that we observe and forecast in the mid and higher latitudes. The graphic for the idealized, double-cyclonic deformation zone chain was made by my COMET friends in Boulder, Colorado. This two dimensional graphic does a pretty good job at portraying what happens in the actual three dimensional atmosphere. Remember that with a warming wind, only the cyclonic swirls are enhanced. 


A chain of deformation zones can be quickly sketched between a series of vorticity maxima (cyclonic swirls and the red "X's") along a channeled jet. As a result of the wave nature of the atmosphere, subtle vorticity maxima can be inferred at regular intervals even if the corresponding satellite signature is inconclusive. 

Vorticity maxima chains are typically located between the bottom of the upper trough and the downstream point of inflection (the black circle in the following graphic) where the cyclonic curvature of the trough changes to the anticyclonic curvature of the downstream ridge. Analysis of these chains is best achieved by locating poleward "bumps" in the axis of maximum winds and the cloud patterns. The lines of moisture will reveal "backward s" shaped deformation zones between the vorticity maxima in the chain. 


The satellite example was from 2003 but such a pattern happens almost every day. Your Coriolis Hand with your thumb pointing upward at every red “X” will reveal the sense of the rotation. If you are looking for weather, be it enhanced cloud or precipitation, look just downstream from each red “X” which move at about a half of the speed of the atmospheric winds – typically toward the northeast. 

Every line in the sky has a tale to tell. I spent countless hours deciphering what the atmosphere had to say and I am happy to share those stories here.  

Keep you paddle in the water and warmest regards... stay safe, 

Phil the Forecaster Chadwick


Monday, May 10, 2021

Cloud Edge Shapes - The "Backward S" Deformation Zone

#2065 "Summer Cirrus" (Singleton Lake, Ontario)

What does it mean if a shifting wind veers? A more global visualization is to take your meteorological Coriolis force hand and point your thumb down. I will explain...

Coriolis Hand with Thumbs Down
Warm Advection
That magical Coriolis appendage is your right hand if you live in the Northern Hemisphere and your left hand if you are down under, south of the equator.  The thumb of your Coriolis hand pointing down, will force your fingers to curl in the same direction as wind shear resulting from warm air advection. The following examples will be for the northern hemisphere as that is where I live and paint. I will try to use the more Global phrase “warming wind” instead of the more nautical and historical term "veering". 

To watch the warming wind veer, implies that the wind shift occurs over a period of time. Historically and mathematically, meteorologists have only considered what is happening when winds veer with height. The answer to both questions is that warm air is being advected by a veering wind, whether that change occurs in space or time. 

Wind Veering with Time Moves Warm Air Northward


Companion Swirls straddle the inflows
Paired Swirls see each other are across the DZ
What impact does a warming wind have on our deformation zone (DZ) conceptual model. Let’s start with the simple straight line DZ. The DZ Conceptual Model is a dynamic concept and how it changes, reveals the weather. The following graphics describe the cause and effect of how the changes in just one component of the DZ Conceptual Model is communicated to the other nine components. It takes longer to explain while the atmosphere does all of this instantaneously. These changes just come naturally. 

The only physical law that we need to apply is the conservation of angular momentum. Figure skaters conserve angular momentum all of the time. Their rate of rotation increases as they draw their body inward to a tight spindle. These same skaters slow their rotation by extending their arms and legs outward. 

Shifting inflow winds along the axis of contraction toward the DZ must impact on the shape of that DZ! As I described in “Lines and Swirls in an Unbalanced Atmosphere” a change in any one of the components of the DZ conceptual model, must be communicated to them all.

What happens to the companion swirls that border the veering wind of one of the inflows to the DZ? The cyclonic companion occupies a smaller volume while the area of anticyclonic companion simultaneously expands. I always associated the font size with the intensity or speed of the swirl  rotation. As a result the red “X” must spin faster in the smaller volume and the font size increases. The blue “N” rotates slower in the larger area and the font size decreases. The total amount of angular momentum remains unchanged for the two swirls just like for a figure skater. 

The “backward-S” DZ

The confluent asymptote adjacent to the big spinning red “X” must curl more cyclonically. The confluent asymptote adjacent to the small blue “N” must curl less anticyclonically - which is the same as saying that the confluent asymptote must curl more cyclonically. Both confluent asymptotes must curl more cyclonically relative to their red "X" swirls. Together these two confluent asymptotes are joined at the “col” to construct a single “backward-S” shaped deformation zone. 

Simultaneously the paired swirls across the confluent asymptotes must respond to the changes induced by the veering inflow. As the red X's spin faster in the smaller volumes and become larger fonts, their paired blue N's must spin slower in their enlarged areas and become smaller. There are many different ways to think about this but the result is always the same. 

The end result in a warming wind shear is a double-cyclonic deformation zone.  Both confluent asymptotes stretching outward from the col are shaped cyclonically and the red X's dominate the pattern. Simply, if the cloud lines are shaped by cyclonic swirls, the atmosphere is warming. 

In the northern hemisphere, a double-cyclonic swirl deformation zone must be shaped like a "backward S" which is the term I used in the 1990's when I first started to describe these concepts. South of the equator a double-cyclonic swirl deformation zone is shaped like an "S". I employed these ideas when I was the meteorological support for the Solar Car Race across the Australian Outback in 1996. I was not successful in explaining those concepts then either…

I played these thought experiments in my mind mainly on night shifts. The words played out like a movie in my mind’s eye. The wonderful thing is that the very same show was being played in the satellite loop of the real atmosphere... which was also my forecast concern of the day.


Double-cyclonic Deformation Zone Chain

Here are the take home concepts my weather friends. When do winds veer in the northern hemisphere atmosphere? Warm advection. Where can you find warm advection? When winds blow from the warm southern latitudes toward the pole. In the northern hemisphere that means southerly winds advect warm air toward the north and winds tend to veer with height... and with time. Lines of cloud must be shaped like backward S's or double-cyclonic deformation zones which is the terminology that I prefer. 

In #2065 "Summer Cirrus" (Singleton Lake, Ontario), the long lines of clouds whether they be a gravity wave or a Langmuir streak have a gentle double-cyclonic shape. Use your Coriolis Hand and point your thumb upward for a cyclonic swirl and you can see that the lines of clouds are a chain of double-cyclonic deformation zones as depicted in the above graphic produced by my COMET friends in Boulder, Colorado. The warming wind was over Singleton Lake on that summer day - and that is part of the story behind that painting.  

More on this in the next entry. Keep you paddle in the water and warmest regards... stay safe, 

Phil the Forecaster Chadwick