|
Smoke Lake
Alternate title: Smoke Lake, Algonquin Lake Spring 1912
Oil on paperboard (Birchmore board)
7 x 9 15/16 in. (17.8 x 25.2 cm)
Tom's Paint Box Size |
In 1976, when I graduated from Queens in Nuclear Physics, I was not aware of the friends that I would make forty years later thanks to Tom Thomson. It turned out that several of my future Thomson friends were also involved in nuclear physics. Except for a twist of fate, I was also destined to go to Chalk River to study and work in the Nuclear Industry. Those friends would have been encountered that much sooner in Deep River, and while paddling the Petawawa and the Dumoine Rivers. One can only ride one horse at a time, and meteorology came along first, so I saddled up. There can be no looking back, but I often wonder.. Giddyup...
Meanwhile, in July of 1977, Jim and Sue Waddington began a 36-year journey of discovery that culminated with "In the Footsteps of the Group of Seven" in 2013. Jim even attended the same high school in Brockville, graduating from BCIVS in 1959. Jim became a professor of physics at McMaster University, specializing in nuclear physics. Jim even married his high school sweetheart, as did I.
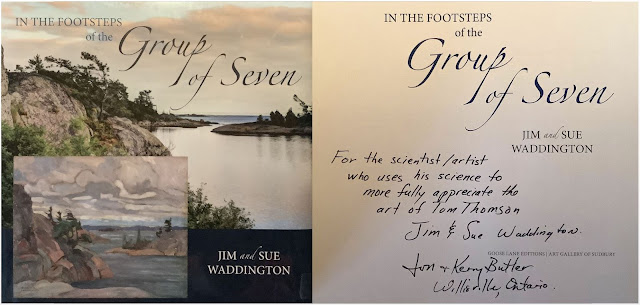 |
| My prized, autographed copy of Jim and Sue Waddington's book |
Diana and Bob McElroy began their investigations into the painting places of Tom Thomson in the 1980s. Bob McElroy also has a strong background in physics. Both Diana and Bob worked at Chalk River. They enjoy a large and significant web presence detailing the painting places of Tom Thomson. I found these sites invaluable when working on the "Tom Thomson Was A Weatherman" blogs.
I am fortunate to count Jim and Sue Waddington, the authors of "In the Footsteps" and Diana and Bob McElroy as friends. We share a similar life stories. They have contributed to several of the posts comprising "Tom". In fact, our ongoing friendship leads to this story.
Jim writes: "Sue read somewhere that Tom Thomson, working as a guide, took people to Molly's Island in Smoke Lake. So that was as good an excuse as needed to go for a paddle. The wind came up, and the skies darkened. The island is small. I remember a small sandy beach on the north side. We crossed the island, took a photo, retreated to the canoe, and got soaked."
 |
| The Waddington photo was taken looking south from the south shore of Molly's Island |
The very best way to start with a Thomson post is with the painting location. Using that information, the direction of view is well established from the get-go. I am only left with the earth sciences to unravel.
Comparing the Waddington photo with Tom's "Smoke Lake" was an interesting exercise that few will ever bother to do. Tom certainly was unconcerned, being in possession of his "Artistic Licence" - as am I. He chopped 16% from the width of the horizon to make his subject fit the small plein air panel. Tom judiciously removed the uninteresting flat portion of the distant ridge line. The following graphic guides you through the steps I took to deduce that cryptic number.
 |
| 2.6 cm chopped out of the flat ridge line in the Waddington photo is 16% of the 16.5 cm wide horizon. |
My long-time Thomson friend and expert Daian McElroy remarked:
"How fortunate that the Waddingtons were in the right spot when the weather was so appropriate. And I found your examination of the details of how Tom tweaked the landscape to be very interesting. Despite those changes, the sketch still conveys the essential landscape - that's the location all right, without a doubt."
The match to the terrain with the described adjustments is indeed almost exact. Tom also frequently exaggerates the vertical extent of the terrain. He refrained from making significant changes to the heights in "Smoke Lake". The subject of this painting was the weather and not the hills.
As noted, the weather in the Waddington photo was a close match to what Tom painted!
 |
| Looking south from Molly's Island across the south basin of Smoke Lake |
The winds were strong southwesterly on the afternoon that Tom painted "Smoke Lake". Using the Beaufort Wind Scale and matching the waves and whitecaps to the descriptions, the winds are estimated to be 20 to 25 knots (37-46 kph) when Tom was painting. The fetch across Smoke Lake is also an important factor, and the winds could have easily been stronger in a more exposed location.
- 17-21 knots- Fresh Breeze- Moderate waves, taking a more pronounced long form; many white horses are formed. Small trees in leaf begin to sway; crested wavelets form on inland waters.
- 22-27 knots- Strong Breeze- Large waves begin to form; the white foam crests are more extensive everywhere. Large branches in motion; whistling heard in telegraph wires; umbrellas used with difficulty.
Note that the waves were much smaller in the lee of the distant shore, so the strong wind had to be mainly from the south. Further, the shape of the cumulus elements (the white arc in the above graphic) comprising the flanking line revealed that the winds at cloud level were southwesterly.
The convective cloud was quite likely a cumulonimbus - simply a thunderstorm. Tom included the rear edge of the flanking line. That cloud was front lit, indicating that the sun was in the western sky - it was afternoon. Thunderstorms typically require significant daytime heating before they fire up, so they are more unlikely in the morning. The cloud was tall above the very dark base, which is characteristic of cumulonimbus.
SCUD is meteorological slang for "
Scattered Cumulus Under Deck". The "
deck" referred to is the base of the cumulonimbus cloud, which is the lifted condensation level (LCL) for the air mass. Daytime heating of the land warms adjacent air parcels, which rise buoyantly to saturation at the LCL.
SCUD are twisted shreds of cloud lifted from the ground by the turbulent winds. The moist surface air parcels are turbulently stirred and lifted to saturation. These air parcels saturate to become clouds "under the deck" if the ground and turbulent air parcels are additionally moist from any preceding rain.
I used the conceptual model for a supercellular thunderstorm as a worst-case scenario. There is no absolutely conclusive evidence in Tom's painting that the convection was even a thunderstorm. Tom did not include lightning this time on his panel. The flanking line is characteristic of the significant wind shear required to create both multi-cell type cumulonimbus and supercells. The following photo depicts a multicell thunderstorm looking from the south while Tom was on the northwest flank of the convection.
Jim Waddington writes:
"Many years ago, my father had a book about instant weather forecasting. I often use the ideas while on a trip. The only trick that I remember was that dark skies with small, low, fast-moving black clouds means 'rain within five minutes'. We were about to get wet but so was Tom."
"Instant weather forecasting" is about learning from the lines in the sky... see "Lines in the Sky and the Meaning of Life" for more details. However,
meteorology is typically much more complex than what can be viewed from your immediate location. Weather is always lurking just beyond the horizon. I advise that a meteorologist accompany every canoe trip...
The trick that Jim remembered, "small, low, fast-moving black clouds" refers to SCUD clouds. Depending on the illumination, the optically very thick SCUD clouds can be dark (backlit) or white (frontlit) as in Tom's weather observation above. The SCUD indicate that it has rained recently nearby and that moisture has been lifted to saturation by strong and turbulent winds. The fact that the clouds can be seen to be moving quickly tells us that they are nearby and thus close to the ground. Depending on the location of the convection, more showers could be just minutes upstream. This is a good trick.
I also asked my colleague Johnny Lade to have a look at this painting as if he were making a weather observation. Known to his students as "Johnny Met", he has a lifetime of experience observing the actual weather. Johnny nailed this observation since Thomson painted exactly what he saw.
"
At first glance, I knew Tom had stopped a summer thunderstorm.
He painted, fast-moving Scud clouds, white caps on the lake, probably a wind shift in the down draft, bringing cooler temperatures, thunder and lightning, and heavy showers. Tops of the cloud would be into the tropopause, moving the cumulonimbus cloud at a fast speed, so quickly that in ten or fifteen minutes, the sun would return. A fresh and cooler air from thirty thousand feet and the smell of ozone.
I worked many thunderstorms in my weather career from daytime heating afternoon summer thunderstorms to the fast moving line ahead of a crashing cold front and the sneaky warm front thunderstorms causing lots of noise in the middle of the night.
Most of my career were postings at airports so passing thunderstorms put a crimp in arrivals and departures with sudden wind shifts: with a head wind suddenly becoming a tail wind needing a longer runway on landing, and small aircraft not tied down on the ramp."
Many thanks to my friend Johnny Lade. His observation rings true, breathes life into Tom's painting, and adds another dimension to the story. Thomson loved painting thunderstorms!
Tom typically reserved his summers for fishing. The biting bugs discouraged staying still in one place for too long, which rules out painting. The potential to fish and be reimbursed while doing so is called "
guiding". Tom was all in for that lucrative enterprise, as art did not really pay.
Molly's Island on Smoke Lake would have been a perfect fishing and camping destination. An interesting 6-kilometre paddle from Mowat Lodge was all it took. The numerous shoals around and just south of the island are still readily apparent on Google Earth and probably attracted great schools of fish in Tom's day, well before the pressure on the fishery increased to current levels.
Inscription verso:
- t., in graphite, Smoke Lake / Algonquin Park;
- c., in graphite, ca. 1912;
- b.r., 5 (circled) National Gallery of Canada, Ottawa (4676)
 |
The edges of Tom's panel show how it was
slid into and out of his paint box.
|
Provenance:
- Dr. J.M. MacCallum, Toronto, c. 1913
- James MacCallum, Toronto, before 1940
- National Gallery of Canada, Ottawa (4676). Purchased from James MacCallum, Toronto, 1946
That's the story behind Tom Thomson's "Smoke Lake". His painting was really another skyscape that focused on the characteristic shapes of clouds and the weather. It was not about the lake at all.
I wish to thank my fellow physicists for their investigative diligence and for tracking the painting places of Tom Thomson and the Group of Seven. They have filled in a large number of blank pages in the art history of Canada. Kudos to the Waddingtons and the McElroys! Thank you... We are all in this together!
Now on to more of Tom's art and meteorology in the next Blog.
Warmest regards and keep your paddle in the water,