 |
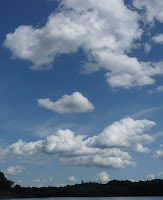
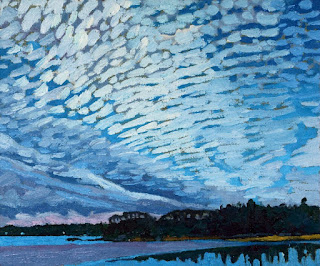
| #2083 "Moisture Conveyors" |
We need to back up and re-establish again why the wind really blows. You will only need your imagination and your Coriolis Hand for this. I will keep this simple with no mathematics and some home-made graphics.
The pressure and volume of any gas varies directly with the temperature. Tall mountains of hot air can be found over the equator. The cold air found over the poles, makes more of a valley in the atmospheric ocean. Pressure results from the weight of the ocean of air that lies above a particular point. The pressure is higher at the ground beneath the hot mountain of air and lower over the cold poles.
The air under pressure naturally flows from the higher pressure found at the equator toward the lower pressure at the poles. This pressure gradient force (PGF) is the fundamental reason for air to move. Lines of constant pressure on the surface are called isobars. Another way to look at the variations in pressure over the globe is to map the height above sea level at which a particular pressure is measured. A line drawn on a weather map connecting points of equal height for a particular pressure is called a height contour. These isolines and are completely analogous to terrain height contours. The 3-D shape of the atmosphere can be depicted on a flat sheet in the same way that the geography of the land can be contoured on a map.
 |
| Contour Isolines can map a 3-D Physical Entity for Display on a Flat Piece of Paper |
But this ocean of air is on a spinning globe. Your Coriolis Hand with the thumb pointing upward at the pole illustrates the sense that the Earth is rotating. For the Northern Hemisphere, your Coriolis Hand is your right hand and every moving thing is deflected to the right by the Coriolis force. The Coriolis force seems real enough but it exists only to explain that we live on a non-inertial, spinning frame of reference. In the Southern Hemisphere your left hand is the Coriolis Hand and everything is deflected to the left.
Air parcels moving in the free atmosphere flows from high pressure to lower pressure but must be deflected by the Coriolis force. In the simplest geostrophic wind, only two forces are balanced – the PGF and the Coriolis force. If you put your left hand in the cold air and your right hand in the warm air, you are looking in the direction this wind is blowing. We will keep all of our graphics in the Northern Hemisphere in order to keep the explanation a bit simpler.

Wind rarely blows in a straight line. A wind blowing in a curve introduces a third force - the centrifugal force. The centrifugal force is what keeps the water in the pail as you swing that bucket quickly overhead. The centrifugal force always points away from the center of curvature. Air moving in a cyclonic trough has the centrifugal force pointing away from the PGF. As a bonus, if you curl the fingers of your Coriolis Hand cyclonically in that trough, your thumb must be pointing upward which encourages ascending air and cloudy weather. The real gradient winds are weaker in the trough.
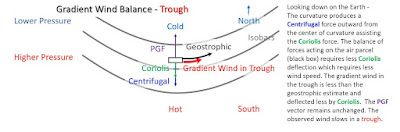
The opposite effect happens in an anticyclonic ridge. The centrifugal force points in the same direction as the PGF and your Coriolis thumb points downward (less cloud in a ridge). The real gradient winds are stronger in the ridge. Meteorologists call the wind that includes the centrifugal force with the geostrophic wind, the gradient wind and it is one step closer to explaining what we observe in nature.


The gradient wind is what we observe in the free atmosphere that lies above the planetary boundary layer (PBL). Gravity waves are exactly perpendicular to the gradient wind so now we have a better understanding of both the gradient wind and those wave clouds - as I painted in #2083 "Moisture Conveyors".
 |
| Today's Weather Maps |
 |
| A real weather map explained... |