 |
| #1714 "White Pine Island" Cloud Patterns within the Atmospheric Frame of Reference and what they mean |
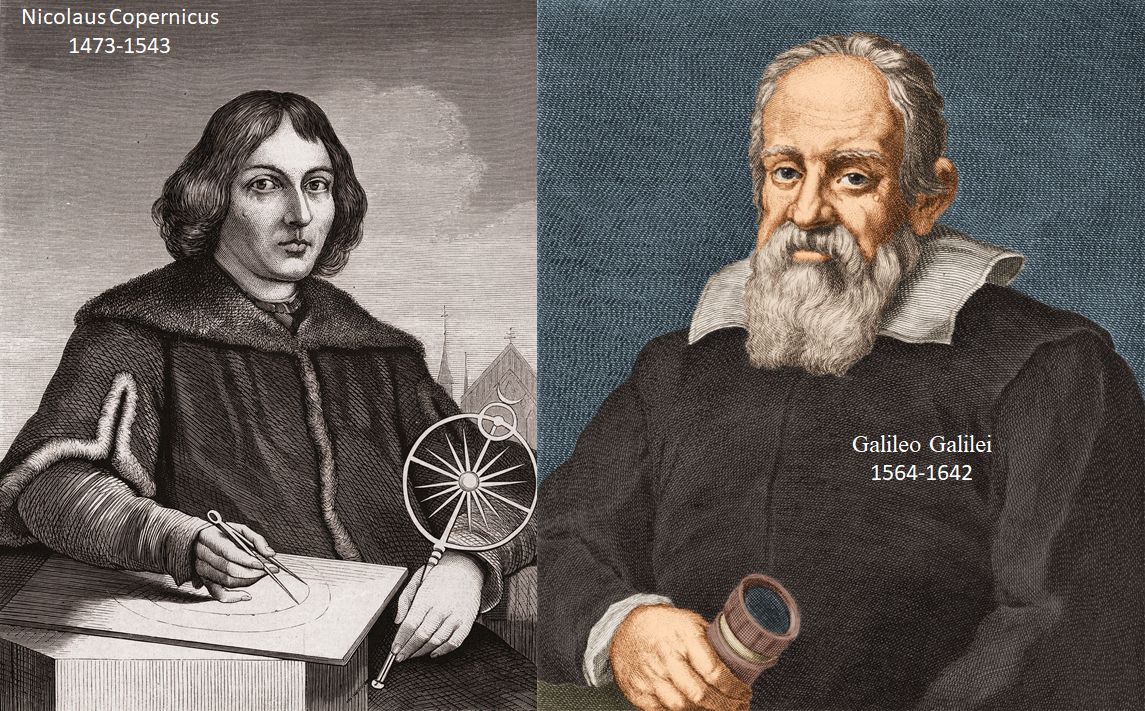
Empathy is important. It is vital to examine a process from the appropriate point of view in order for it to make the most sense. Humans are anthropocentric by nature - which is very unnatural! Ask Copernicus and Galileo about the challenges they faced - great minds who dared to think outside the proverbial box encountering obstacles beyond belief.
Meteorology in Canada flourished out of a necessity for safer air travel - simply to avoid storms. Aviation requires a frame of reference attached to the airports and constant pressure surfaces. A fluid on a rotating, oblate spheroid like the Earth does not care much about any of that. Fluids can be better understood following an empathetic frame of reference moving with the fluid.
Air parcels follow constant energy surfaces (isentropic surfaces) fuelled by contrasting temperatures between the equator and the poles (see "The Jet Stream - The Bind that Ties"). The average westerly winds of the jet streams in both hemispheres move the storms along but what shapes those patterns? The answer is indeed blowing in the wind and using a frame of reference attached to the storm.
 |
| The purple local wind maximum spins up two, adjacent companion swirls |
A puff of stronger wind (local maximum in the jet stream and the purple vector in the accompanying graphic) creates two paired vortices. The so-called "cyclonic" or vorticity maximum (red X) is poleward of the jet maximum (in the northern hemisphere to the left looking downstream). By meteorological convention, the "anticyclonic" or vorticity minimum (blue N) is equatorward of the jet maximum (to the right looking downstream in the northern hemisphere). Use your Coriolis Hand to visualize these paired rotations - your right hand for the Northern Hemisphere and the left hand for Down-under.
These paired circulations are simply cross-sections through the three-dimensional smoke ring blown by the local jet maximum but this blog is more about the patterns caused by the rotational swirls as viewed in the empathetic, atmospheric frame of reference. (See "What do Smoke Rings have to do with Croquet?" for the three-dimensional approach)
The shape of the moisture patterns is determined by simple vector addition:
- the relative strength of the local wind maximum which determines the rate of rotation of the accompanying swirls; and
- the speed at which the swirls are being translated along by the jet stream.
I did this work on a night shift sometime in the early 1980s. I saw a pattern in the newly available satellite imagery and simply asked "why?" The real atmosphere was the best teacher I could have hoped for.
The following graphics are the same for whatever speed we wish to assign to the local wind maximum. The associated weather is of course more intense with the stronger jets.
In "Rotation is the Key to Unlock Cloud Shapes" I explained how the cyclonic swirl in the atmospheric frame of reference formed an open trough in the Earth Frame.

 |
| When the vectors of the rotational swirl match the translational vector, an incipient low is about to form in the Earth frame of reference - the same low-pressure area that meteorologists analyse on weather maps. |

The clincher is that the centre of the swirl in the atmospheric frame of reference is exactly the centre of the moisture swirl that we witness in satellite imagery - and that is the relative vorticity centre using meteorologist lingo. That is what I discovered on that night shift while closely examining the grainy, hard-copy infrared satellite image. It was a eureka moment for me that would define most of my meteorological life.
The swirls in the satellite imagery could be analyzed as vorticity centres. Vorticity centres were a staple of the products found in numerical simulations of the atmosphere. Comparing the location of the vorticity centres in the real atmosphere with those in the numerical, simulated atmosphere could lead to improved predictions especially when strong vortices were involved.
It was really that simple. My goal was to teach this at Training Branch back in the mid-1980s. I was not successful then but did have some success eventually in Boulder, Colorado at COMET. Some of this work can be found within the COMET online material and it is all free - so the price is very right. I have reproduced some of that material in these blogs because it is so very important in order to understand cloud shapes. See "Cloud Shapes from Rotation" for more on this. The additional influence of wind shear that spins up swirls is required to make a cusp in the cloud formation.
The identical process can be described for the anticyclonic swirls.
 |
| Open anticyclonic ridge - fast-moving fair weather |
 |
| Incipient High in the Earth frame of reference when the rotational speed of the anticyclonic swirl is the same as the speed of translation |
 |
| The location of the high-pressure centre shifts in the anti- Coriolis Deflection direction (to the left in the northern hemisphere) as the speed of translation diminishes to zero and the high-pressure centre analyzed on the weather map in the Earth frame of reference is collocated with the anticyclonic swirl. |

