Thursday, December 30, 2021

No Explanation Required

#2435 "Overcast Sunflowers"

Sometimes the art of science does not require any explanation. Colours and light just need to be appreciated even on a cloudy day. Merry Christmas and Happy New Year. "Overcast Sunflowers" speak of longer days and a new season of growth ahead. Choose to be happy. Sunflowers are the perfect inspiration at the time of Winter Solstice. 

Keep you paddle in the water and warmest regards,

Phil the Forecaster Chadwick

Tuesday, December 21, 2021

Contrail Drift


Contrail Headed to Pearson International
midday on Winter Solstice 2021

Practice is important. Learn the science and then apply and reapply daily. Like sunscreen. 

Science Tuesday "Weather Watching Guide - Contrails" from this past February described how contrails could talk. As a result of decades of observation, I knew what this contrail was saying. You might know the answer intuitively without refreshing the science background. It is OK to guess but clients of my meteorological predictions when I was employed by Environment Canada, preferred the science. Clients making important decisions based on those forecasts often asked "how and why" I knew something should happen. 

On another Science Tuesday, I wrote about the down-side of contrails in "Blue Sky Blues". Unnatural alteration of the natural environment was a theme of that Blog entry and many others. The 2021 ozone hole reached its maximum area on October 7, peaking at 24.8 million square kilometers – roughly the size of North America. This hole ranks as the 13th largest since 1979 and is likely still persisting into December. This leads back to the application of sunscreen. 

My goal is simply to learn more about the natural world and its laws and maybe share that information. Perhaps through science we can help protect nature and make sound, ecological practices a part of everyday life. Listening to nature is a good thing. We should all do it more often. 

Keep you paddle in the water and warmest regards,

Phil the Forecaster


Monday, December 13, 2021

Keep an Open Mind

#2564 "Singleton Sunday Thanksgiving Sunset" 
8x10

One of the most important lessons in life and particularly for a meteorologist, is to keep an open mind. New facts and contributions from the fireside chat discussion might contribute to your analysis and diagnosis. More and better facts can lead to a better prediction. Missing information in this sunset sky is an example of how you could be mislead.

As per my sunset ritual, I watched a patch of overhead altocumulus drifting southeastward. Meanwhile the atmospheric frame relative winds were southwesterly as revealed by the distinctive wind gravity waves within that cloud. Wind waves in the atmosphere are shorter wavelength with less amplitude as compared to atmospheric swells. The sky was clear to the horizon and the setting sun. "Orange sky at night, sailor's delight". The saying calls for a "red" sky but the meaning is the same. The atmosphere was dry as far as I could paint and the saying predicted a cloud free and precipitation free day to follow. I was troubled by the angle that the wind waves made with that sharp cloud edge and wondered why...

Water Vapour imagery corresponding to the
Singleton Thanksgiving sunset of #2564
In the Bible, (Matthew XVI: 2-3,) Jesus said, “When in evening, ye say, it will be fair weather: For the sky is red." No one had access to satellite imagery 2000 years ago. Jesus was well intentioned for sure but he would have been wrong in this sunset case. This is a good example of how an additional piece of data could be used to improve your prediction. 

There was a warm conveyor belt originating from the American midwest. The lateral banding of wind gravity waves could even be witnessed in the water vapour imagery. The band of moisture over Singleton at sunset was not just a random piece of moisture but the crest of a swell providing additional lift in an increasingly moist air mass. The cirrus level deformation zone was already to the northeast of Singleton. I wrote about this weather pattern in "Sunrise or Sunset - Gravity Waves and the Deformation Zone" if you wish additional information. The wind waves were at an angle to the swell crest for a very good reason as will explained by the following graphic. 

Satellite Overview of the Cyclonic Companion (left) and the Anticyclonic Companion (right
Separated by the Jet which is near the centre of the Warm Conveyor Belt

Closer View of the Anticyclonic Companion with the
Cloud Enhanced in the Swell and Wind Wave Crests
Looking Downward from the Satellite View
An Example of Constructive Interference

Conceptual Model Compared to the 
Water Vapour View - A Match
(Close Counts in Meteorology)

The portion of the conceptual model that is displayed in any given weather situation is dependent on the relative amplitudes of the swell and wind gravity waves and the lifted condensation level of the atmosphere. The circulations are always present but without water vapour or condensed cloud droplets, they are invisible.

The following graphic places the Singleton view of the small portion of the deformation zone within the larger scale Conveyor Belt Conceptual Model.  

The Three (Four) Dimensional Atmosphere can 
be a Challenge to Interpret - Even for the Experts

To recap: The patch of moisture that I painted was drifting southeastward  as part of the anticyclonic companion flow of the conveyor belt conceptual model. This pattern is typical given our location in eastern Ontario (the yellow star in the graphic) and the fact that most emergent weather systems approach from Colorado or the Gulf of Mexico. Singleton typically sees the anticyclonic companion of the approaching storm first. 

The sharp back cloud edge that I painted was the western edge of the crest of an atmospheric ocean  swell. The enhanced bands within that swell crest were wind wave crests in the anticyclonic flow. The fact that the wind crests made an angle with the swell edge revealed that there were two different processes at work. Dynamic forces in the atmosphere create the weather that we enjoy and the approaching conditions were not fair. 

Note that the double cyclonic DZ in the above analysis is entirely within the upper trough while the bowed DZ stretches from the upper trough to the downstream ridge that is east of Singleton. Also note that there is more cloud (upward vertical velocity) associated with the cyclonic companion of the conceptual model than the anticyclonic branch. That is enough information for now - no need to go down the satellite detail, rabbit hole even if there is so much more to see and understand ... One satellite image could keep me busy for hours... 

With these new pieces of data, one must amend the Biblical forecast for the following day from "fair- sunny with no rain" to "cloudy with rain"... This is a actual example of a specific weather situation and a real painting. I was thinking "red sky at night" when I did that art although I was troubled by that angle of the wind waves. The take home message is that nature is always right. Our interpretation could be faulty if we do not listen to all of the facts.  

#2564 "Singleton Sunday Thanksgiving Sunset"
In Progress - Starting tithe the meteorology
There is no shame in amending a forecast (or a painting for that matter) ... I have amended a forecast once or twice during my career (humour intended - the only time when I did not revise a prediction was on a day-off). The crime would be in not using all of the available data and providing a better service. Keeping an open and inquisitive mind is a big part of learning and helping others. 

The clouds always tell the truth even if humans might not fully understand. I paint what I see and nature always makes sense even if it might take some effort to unravel those lines in the sky. 

Keep you paddle in the water and warmest regards... 

Phil the Forecaster Chadwick

Monday, December 6, 2021

Lines in the Atmospheric Ocean

# 2570 "Cirrus Sunset from the
Bottom of the Atmospheric Ocean"

In the previous blog "Finding Deformation Zones", I promised more art and less science for this Science Tuesday. I used painting number 2570 "Cirrus Sunset from the Bottom of the Atmospheric Ocean" to illustrate how to best find those deformation zones - but I did not explain the art within the context of that art. The sunset sky from Wednesday October 27th, 2021, was an example of a double cyclonic deformation zone embedded in a very large upper trough of low pressure and a nearly stationary southerly flow. The lines in that sunset sky did not easily reveal these truths and I promised to provide an explanation. 

Enjoying this Singleton sunset made me really ponder the orientation of these particular lines in the sky. The complexity of the patterns really emphasized that we do indeed reside at the bottom of a very deep and very dynamic ocean of air. The answers were not immediately obvious. I need to explain this sunset a bit. 

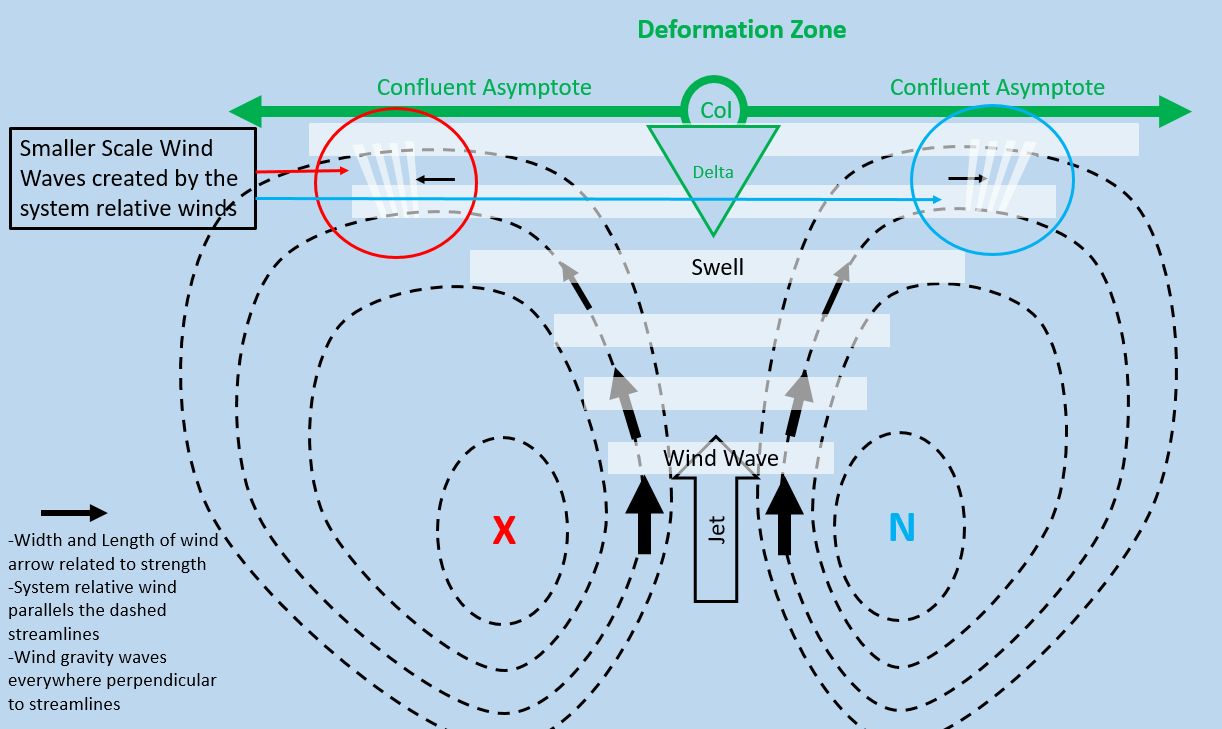
Observing from our Earthly viewing platform reveals the following. There were at least three bands of cirrus above Singleton with clear skies beyond them at least as far as the western horizon. The far edge of the westernmost cloud edge was sharp and  had to be a deformation zone but something was unusual. The well-defined cloud edge was on the western flank of the cirrus band and the moisture was to the east of the deformation zone. Gravity wind waves were embedded within the three swells of cirrus. Remember that long, wavelength ocean swells propagate great distances from their windy source. I was attributing the three bands of cirrus to be atmospheric swells. 

The meridional flow of the jet stream
 revealed a southerly
flow from the Gulf of Mexico
over all of Ontario. 
The drift of the cloud within the bands was from south so the atmospheric winds had to be southerly. Wind gravity waves embedded in the swells were consistent with the earth observation of southerly winds. Some faint ice crystal virga wafted toward the ground while catching the last rays of the setting sun. These trails of virga were in front of the cirrus swells from my vantage. The augmented updrafts where the crests of the wind waves overlap with the crests of the swells, are where you are most likely to find virga. Weather typically exhibits these wavelength properties. 

The dark sunset colours low on the horizon were the glow of the setting sun catching dust in the boundary layer of the atmosphere, stirred up by a daytime of wind and human activities. Smoke and the exhaust of industries from around the busy ports of the Great Lakes would easily explain those somewhat murkier colours. 

To complete the diagnosis of the sunset sky, I would have to consult the view from space. The water vapour imagery confirmed the orientation of the deformation zone over Singleton. But the weather story was even more complex. I was viewing just a small portion of a much larger double cyclonic deformation zone. That line in the sky was associated with an upper cyclone near Timiskaming and a second low well southeast of Cape Cod. Recall that double cyclonic and double anticyclonic deformation zones tend to be nearly stationary with respect to the globe. The next morning dawned cloudy and the satellite imagery confirmed that the pattern had even retrogressed toward the west, bringing the overcast skies with it. The jet stream was in a highly meridional flow pattern consistent with that expected from a weakening flow associated with climate change. 

The area of the water vapour imagery where I sketched in the double-cyclonic deformation zone conceptual model, shows a stronger northeasterly flow actually sinking as it headed southward. The cyclonic x's were actually 3D vortex tubes stretching through the depth of the atmosphere. The moisture over Singleton marked by the little yellow star, was actually rising as it headed northward. This pattern was not moving far but was likely to shift to the southwest with the stronger winds as I noticed the following morning. 

Classic Water Vapour Imagery revealing 
the Meridional Flow Pattern

The highly contorted flow revealed by the water vapour imagery, was typical of the wave number seven of the weakening jet stream. Instead of following the lines of latitude as a zonal, strong current of air, the jet stream was more likely to follow the meridional lines of longitude northward and then southward again in a series of ox-bow lakes. That kind of pattern was over Singleton in that sunset sky and it also told the story of climate change. 

This sunset weather story was unusual in that the weather was approaching Singleton from the east. The typical progression of weather from the west was upset and I think this would cause the viewer some anxiety although they might not really comprehend why. I remember stories of ancient peoples being terrified at the sight of an eclipse. We are not much different. At one time, these strongly blocked and convoluted patterns were very rare. 

RGB imagery like this Nighttime Microphysics
Image, combines several channels and typically
complex combinations of channels to the red, green,
and blue colours. The physical properties of the
earth-atmosphere system are better understood
by using both colours and tones to paint the data.

Satellite imagery reveals details and complexities that could keep professional meteorologists entertained for days. I know that from experience! Most people should not venture down that rabbit hole. Always remember that the atmosphere is a complex three or four dimensional flow. It is sufficient to just understand the big picture, at least to start. 

The clouds always tell the truth even if humans might not like to hear it. I paint what I see and nature always makes sense even if it might take some effort to unravel the lines in the sky. 

Keep you paddle in the water and warmest regards... 

Phil the Forecaster Chadwick