Thursday, February 27, 2020

Cloud Shapes from Rotation

#1828 "Just Another November Sunset" Pixels Link
In "Rotation is the Key to Unlock Cloud Shapes" streamline curvature rotation was created in the atmospheric frame of reference. How this rotation was viewed from the earth frame was studied at ever decreasing speeds of translation. The atmospheric frame and earth frame become identical when  the atmosphere frame stopped. What does all of this mean to cloud shapes?

Surprisingly meteorologists did not really understand what shaped the moisture in the atmosphere. In 1977 the thrust was into modelling of the atmosphere in the burgeoning computer age. Great strides were being made as supercomputer technology raced forward. It was very inspiring but not where my mind was... and I did not have access to those computers.

I was more interested into applying the human computer to answer some of these very basic questions. Then along came satellite imagery … The artistic, right side of the brain was all anyone needed and I played some mental imaging games every time a cloud came by - which was very frequently. An updated analysis and diagnosis of the real, physical atmosphere was available with each new image. A meteorologist could easily understand what was really happening in the atmosphere and get the jump on any computer model and construct a better forecast. Imagine the power!

I started simply with pure rotation. All of this was completed within the atmospheric frame of reference which was described in “Why are clouds shaped the way they are?". I used water vapour imagery for reasons that I will make clear someday but not today.

The accompanying animations (if they work) are worth thousands of words in describing how cyclonic swirls shape moisture in the atmosphere. The blue arrows represent the simplified atmospheric frame streamlines or wind and the size of the arrow correlates with the relative speed of that wind. In these graphics, the letter “R” is used to locate the centre of rotation resulting solely from curvature in the flow. The letter “S”, which will come, locates the centre of rotation resulting solely from wind shear. Together, curvature and wind shear cause the moisture to spin and their combined effect results in a centre of rotation located by the letter “X” denoting cyclonic rotation. The relative font size of the "R" and "S" is related to their relative contributions to the total spin.

The red “X” is considered to be positive or cyclonic (counter-clockwise in the northern hemisphere) rotation of the atmosphere. The resultant cloud edges are actually two cyclonically curved arcs that meet smoothly at the centre of rotation. Pointing your right thumb upward at an “X” also points your fingers in the direction of the cyclonic rotation of the atmosphere.


The other type of rotation is caused by wind shear. The streamlines that create cyclonic shear rotation are straight. The speed shear alone induces the rotation. Frames of reference with speed shear must translate relative to the earth. In the accompanying graphic the area of the rotation would translate to the right at the average speed of the vectors. The centre of rotation for speed shear is adjacent to the maximum wind. Looking downstream, a vorticity maximum is to the left of the wind maximum and a vorticity minimum is to the right. 

I then added this wind shear to the pure rotation case to create a swirl and more realistic patterns that compared well with what we witnessed in the satellite imagery. These patterns move with respect to the earth. I had to expand my frame of reference to include the entire storm in order to achieve a window of the atmosphere were the vector sum of all of the winds came close to zero.

Following the flow along the cyclonic arcs still meet at the centre of rotation. The point of inflection is not smooth but is a cusp when speed shear rotation is added into the mix. 

Stronger wind shear creates a more pronounced cusp and the sharpness of this cusp increases both with time and the intensity of the wind shear. The vorticity centre red "X" ends up closer to the original position of the more dominant speed shear component "S".

If one practices this just a few times, you will understand cyclonic cloud shapes. Follow the cloud edges to the curvature of the arc changes. That is your centre of rotation.


More to come...


Sunday, February 23, 2020

Rotation is the Key to Unlock Cloud Shapes

#2216 "Singleton Winter Contrails Cirrus and Deformation" Pixels Link
The meaning of life can be discovered by simply gazing at the sky. For sure there are several steps to take before we get there. My career as a weatherman all started by watching clouds and asking why? Long before I became a meteorologist. Please bear with me – we are going somewhere interesting.

The first step is to look at simple rotations in the atmosphere. In the atmospheric frame of reference, there can only be rotation. Simple rotation sculptures patterns in the atmospheric moisture and those shapes reveal the secrets of the weather.

Meteorologists have historically divided rotation into two classes – either cyclonic, that of a low pressure area or anticyclonic rotation, that of a high pressure area. When looking down at them in the northern hemisphere, cyclonic rotations spin counter-clockwise and anticyclonic rotations turn clockwise. These conventions will become much simpler and more meaningful in a few more posts but let us not rush things.

In “Cloud Shapes and Lines in the Atmosphere” I jumped right to the deformation zone conceptual model by revealing how these simple lines can form in the atmospheric frame of reference. These deformation zone lines can be understood in terms of rotation as well and that is where I am headed - but not yet. These deformation zone lines in the atmospheric frame will reveal their associated rotations. Cloud shapes and the preferred locations of clouds must follow and this leads us closer to the weather. Rotation means everything to the weather and in those truths, somewhere is hidden the meaning of life.

Cyclonic Rotations in the Atmosphere – how do they move? I will use more pictures than words in an effort to make this comprehensible.

Let’s imagine pure cyclonic rotation in the atmospheric frame of reference - the green frame on the right side of the above graphic. If we move this rotation with respect to the earth (the single purple vector in the middle above), the wind vectors that we must measure from the ground can be easily constructed - the purple frame of reference on the left in the above graphic. The "Frames of Reference Equation” goes both ways! The lines following the flow (dashed purple streamlines) look like a tough or a valley from the earth-bound view. These lines can be approximated by isobars on a surface weather map or height contours on an upper air chart. The curvature and spacing of these lines can be handled mathematically in the science of meteorology but there is no need for us to go there.

Pure rotation that is moving very quickly relative to the earth will be dominated by a strong translational vector. The trough following the winds in the earth frame will be shallow and perhaps difficult to see.

As the movement of the area of pure rotation slows in the earth frame of reference (the single and shorter purple vector in the middle above), the translational vector decreases. The vectors defining the pure rotation become a larger proportion of the total vector in the earth frame. The rotational vectors carve a deeper trough in the flow pattern following the winds in the earth frame of reference.

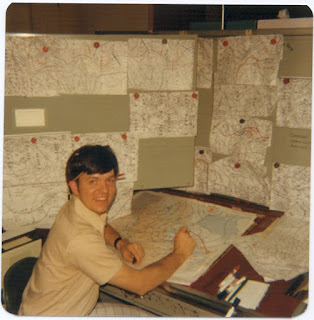
When the rotational speed of the vortex equals the speed of translation, a calm wind is created on the north (top of the earth frame purple graphic above) side of the cyclonic rotation. What meteorologists analyse as a low pressure centre is about to be created on the surface map in the earth frame of reference. A further decrease in the speed of translation must produce an east wind in the earth frame. This east wind invites every meteorologist to analyse a low pressure centre in the earth frame immediately to the south of that wind. You can tell from this 1977 image of a very keen and young meteorologist, that I loved finding those easterly winds and lows.
In 1977 Meteorological Technicians hand plotted hundreds of weather observations on large maps of North America complete with geopolitical lines and terrain. There was no doubt which frame of reference you were analyzing. When the map was completed, the combination of the skills of all of those involved, often created a work of art as well as science. Those are indeed pencils growing out of my ears and yes, I had many more coloured pencils in a plastic case tucked into my shirt pocket. One needed many colours to synthesize the analysis into a mental image of the atmosphere and the processes influencing the weather. Analyzing a weather map was a learning experience. Never stop learning.   
As the speed of translation of the cyclonic rotation decreases further, the low pressure centre in the earth frame shifts southward. The upper trough in the earth frame becomes deeper as the translational speed of the cyclonic rotation in the atmospheric frame decreases further.

When the pure rotation stops moving in the earth frame as depicted in the above graphic, the rotation we see in the atmospheric frame is identical to what we see in the earth frame. That upper trough transforms to a cut-off low when the translation of the rotational centre stops.


I hope you are still with me. I started presenting this material in the early eighties and have lost mostly everyone at one point or another. I have tried describing this process in many different ways hoping that one of the methods will form a connection. Once you get it, you will have it for life. 

The impacts of that rotation on cloud shapes will surprise you... but that is for the next day. 

Thank you for getting this far...

Tuesday, February 18, 2020

Cloud Shapes and Lines in the Atmosphere

#2216 
"Singleton Winter Contrails Cirrus and Deformation" Pixels Link
This is the grown up version of#1533 "Long Reaching Deformation Zone". The small panel begged for a larger rendition because of the design and the meteorology. I hope that bigger is better in this case. This painting also tells the story of why clouds are shaped the way they are. It’s all in the spin that you put on the moisture. 

Cloud are born, live and die within the atmosphere. We have to view them from our fixed location on the surface of the earth. It is our only option and we see some wonderful patterns. If we want to really understand the cloud shapes though, we need to examine them from the atmospheric frame of reference. When we examine clouds from the atmospheric frame the complex patterns become much simpler.

To view the clouds from the atmospheric frame we need to move with the average motion of the clouds. Let’s consider an area of interest and average all of the winds observed from the earth’s surface to calculate the average surface observed wind within that box. Every observed wind can now be expressed as the sum of this overall average wind and a wind difference. This wind difference is the wind in the atmospheric frame of reference and it shapes the clouds. In other words the atmospheric frame of reference is an observational platform or coordinate system moving with the mean flow of the atmosphere. Some graphics might help. 
In the above graphic our simple atmosphere consists of four points. In this simplest case for the purple earth frame. These four points are all moving in the same direction and at the same speed. The average of these four identical motions is the same purple vector. In the green atmospheric frame of reference the four points are stationary. They are not moving relative to each other. The winds measured in the purple earth frame of reference are simply the addition of the mean motion of the earth frame winds plus the wind difference measured in the green atmospheric frame of reference for each of the four points. The shape of any cloud will not change if all of the points within this cloud are moving with the same velocity which must also be the average velocity for the box of atmosphere we are observing. 


In the second graphic above we have changed the winds in the atmospheric frame of reference very slightly. Two of the points in our simple four point atmosphere are approaching each other at the same speed. The average of these two atmospheric frame winds is zero so they do not change the average wind in our atmospheric box at all. If we add these atmospheric winds to the mean wind, the winds as seen in the earth frame of reference are the solid purple vectors within the purple box. Earth born meteorologists would simply observe a slight increase followed by a slight decrease in the westerly winds – if we add the points of the compass to our simple graphic (north being upward on the page). Such a minor variation in the west wind would be a challenge to observe. 


However something almost magical is revealed in the atmospheric frame of reference – a line is born in the cloud field! Any moisture within our simple atmosphere must be stretched parallel to the green double headed arrow which is the symbol for the deformation zone. The deformation zone is my favourite meteorological tool and I helped to discover the mysteries behind it. The shape of cloud line in the sky and the deformation zone can reveal everything about that portion of the atmosphere and the weather. 


The variations in the wind speed is wind shear and this causes the atmosphere to rotate like a child’s pinwheel. By convention the red “X” is considered to be positive or cyclonic (counter-clockwise in the northern hemisphere) rotation of the atmosphere. The blue “N” is considered to be negative or anti-cyclonic rotation cyclonic (clockwise in the northern hemisphere). The right hand rule makes this easy to remember. Pointing your right thumb upward at an “X” also points your fingers in the direction of the cyclonic rotation of the atmosphere. Pointing your right thumb downward at an “N” points your fingers in the direction of the anti-cyclonic rotation. 

Rotation in the atmosphere is very important to the weather but it is even more important in shaping the clouds. The mean wind in the atmosphere may move the clouds around but it is the rotation caused by subtle wind shear that really shapes the clouds. In addition and with admittedly great simplification, rising air and thus clouds are more likely located in the quadrants of the deformation zone conceptual model occupied by the red “X”. The opposite and descending cloud free air is more likely in the blue “N” quadrants. 

The observation of a line of cloud in the atmosphere can reveal the subtle relative motions within the atmosphere itself. The power of this conceptual model and the understanding of cloud shapes is remarkable. I have made a career out of unravelling these truths which were once mysteries. There is much more to come. 

There are other analogies that can be used to explain frames of reference. One can think of the atmospheric frame as a box car of a train. All of the box cars are moving at the same speed as part of the train. Simple patterns can be made within each box car through uncomplicated relative motions that are easily understood within each of the cars. Observing and explaining these motions and shapes from the siding outside the train is much more problematic and full of twist and turns. 

The take away truth is that if you really want to understand the clouds and atmospheric motions, you need to live in the same world as the clouds. The secret is to look for lines. 

I will place other simple motions within the atmospheric frame and hopefully, open the beautiful world of clouds up to you… much more to come along these lines… so to speak.