Tuesday, May 26, 2020

Observing Warm Conveyor Belts and Forecasting Your Own Weather


#1717 "Sunset Waves Nite" Pixels Link
This is the last post on the warm conveyor belt before we move on to the dry conveyor belt. Exciting times for sure! The goal is to figure out just what part of the storm is about to pass your location. The warm conveyor belt is the most visible part of that storm and provides the answer. You can do this!

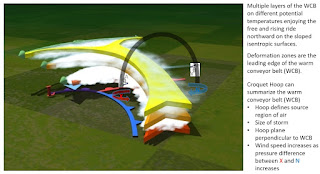
To become an armchair forecaster, first position yourself to look southwestward... more or less. Most warm conveyor belts approach from the southwest more or less, at least over southern Ontario. If you wish to be more exact, note the current orientation of the jet stream over your location and use that portion of the flow that lines up with the warm conveyor belt. Turn your armchair to look into the jet stream. The jet stream guides the storms and the warm conveyor belt and is the purple line in the accompanying graphic.

Apply these tips to deduce the atmospheric frame winds.
  • The deformation zone has a characteristic orientation to the winds in the atmospheric frame of reference – regardless of the spatial scale of the deformation zone. If you are looking into the col, you are looking into the wind. See A Closer Look at Lines in the Sky.
  •  Langmuir streaks parallel the atmospheric frame of reference winds – even though they might look like they diverge similar to crepuscular rays and train tracks… see Langmuir Streaks 
  • Gravity waves your best friend and are everywhere perpendicular to the atmospheric frame of reference winds. The spacing of the gravity waves varies directly with the speed of those winds. The waves also drift in the same direction as the generating winds just like waves on a lake.

Armchair Weather Observation Platform
Now is the really fun part! You need to sit in the armchair looking directly into the approaching warm conveyor belt. Identify a characteristic piece of cloud that you hope to follow for a few minutes. 

Line that piece of cloud up with the window frame or something not moving and watch which way it drifts. In a few moments you should be able to tell which way that cloud is moving relative to your earthly vantage. Since you are already looking into the warm conveyor belt and the approaching storm, you are looking at mainly the motion of the cloud due to winds in the atmospheric frame of reference. 


If that cloud piece is moving to your right ... the cyclonic companion of the warm conveyor belt is approaching. Point the thumb of your right hand upward and see if your fingers align with any of the swirls in the cloud. There could be gravity waves in the cloud perpendicular to your fingers and the atmospheric frame winds. There should also be a considerable amount of cloud. See The Cyclonic Side of Life for more details. 


If the characteristic cloud is moving to your left, the anticyclonic companion is in line with your location. Point the thumb of your right hand downward and see if your fingers align with any of the swirls in the cloud. Gravity waves are likely in any cloud that might be present. There may not be much cloud as well and that is part of the clue. See The Relativity of the Companion Flows in the Warm Conveyor Belt for a look at the anticyclonic companion. 


If the cloud is not moving appreciably either to the right or left, you are looking directly at the col in the deformation zone. Lucky you! If there is no delta void in the cloud on the warm side of the deformation zone, then the companion vortices are less intense than average. As the companion swirls increase their spin speed with a corresponding increase in the velocity of the winds in the warm conveyor belt, moisture is increasingly spun away from the col. The delta shape becomes progressively void of moisture - another important clue to the wind speeds in the warm conveyor belt. These winds bring the heat and moisture energy to fuel the storm.  

It is typical with the approach of the warm conveyor belt that the conveyor belt pattern will continue to move along with the jet stream. You may initially see the cyclonic companion but if the storm is far away, the col and eventually the anticyclonic companion could be what you actually receive as weather when the storm eventually arrives. You will need to repeat this exercise as the storm progresses. It will mean sitting and watching the sky. I know you can do this…

You can also enjoy a satellite view of the patterns if you get tired of looking out your window. I prefer a site created by my friends at UCAR (University Corporation for Atmospheric Research) in Boulder, Colorado. Simply Google “UCAR Real Time Weather” and select the mid-level water vapour image for best results. http://weather.rap.ucar.edu/satellite/  If you follow the storm in an animation, your brain and eye will automatically focus on the relative motions of the cloud features that are created in the atmospheric frame of reference. 

Weather is important and it can also be fun! Enjoy the weather when it arrives ... evaluate your prediction (this is also called performance measurement). Have fun and learn... repeat this exercise daily. Embrace nature... it is very good for both you... and nature. 

In #1717 "Sunset Waves Nite" I recorded the leading edge of the anticyclonic companion in oils. Art and science merge. 

Warmest regards and keep your paddle in the water,
Phil the Forecaster

PS: There is no crime in updating, revising, amending or rewriting any forecast based on new observations when they become available. Doing so just indicates that there is still something to learn from nature and that your goal is to better serve your clients. :>)) Anyone who has never fixed a forecast, has yet to really write one that said something worthwhile and of potential benefit to the client. Thank you for reading and getting this far...


Tuesday, May 19, 2020

Storm of the Century

#2185 "Virga Singleton Sunset" Pixels Link
The 1993 Storm of the Century is also referred to as the 93 Superstorm, The No Name Storm, or the Great Blizzard of 1993. It was a large cyclonic storm that formed over the Gulf of Mexico on March 12, 1993. The storm was significant for its intensity, size, and effects all of which could be witnessed by looking at the warm conveyor belt.

I typically arrived early for my shift at the Storm Prediction Centre – ahead of traffic and certain to be on time and ready to go. I headed to any unused workstation and flipped on the water vapour network. With my coffee, I simply sat and watched the animation of the imagery. The atmosphere told me what the concern of the day might be and where we needed to expend our analysis and diagnosis energies. Our area of responsibility was huge and there were bound to be multiple concerns during the shift. The limited staff at the weather centre had to be prudent and thoughtful about workload. 

I applied conceptual models to make sense of the evolving shapes and patterns. Not only was this approach to the weather fun and stimulating but it made use of the human skill sets. Those same talents allowed us to out-compete the saber toothed tigers and other, larger and stronger creatures as we first ventured out of our caves. 

Conceptual models based on remote sensing was the approached I preferred to find the problem of the day and simply focus on that… leaving the other areas OK because there were nil problems there anyway. The satellite imagery spoke to me. I did a lot of arm waving but could not convince many of the message those satellite images might be revealing.

I would rather work the big storms. They have more to teach. The memorable storms like Hazel, Sandy and even Isabel also have more impact for safety and security. The 1993 Superstorm was such a storm!

The Storm of the Century devastated the eastern coast of North America during March 12–15, 1993. The storm killed more than 250 people as it moved from the Gulf of Mexico into Canada. It was one of the most intense mid-latitude cyclones ever observed over the Eastern North America. Snowfall totals from Alabama through Maine were tremendous. Strong winds buffeted the East coast along with extensive coastal flooding. The barometric pressures reached new lows. All of this was followed by unseasonably cold air. In terms of human impact the Superstorm of 1993 was more significant than most hurricanes or tornado outbreaks and ranks high among the deadliest and most costly weather events of the 20th century. The warm conveyor belt (WCB) told the story. 

Things to note:

  • The orientation of the warm conveyor belt turned cyclonically or counter-clockwise as it rose northward. The croquet hoops illustrate this.
  • Animation is required to locate the col in the deformation zone. Moisture must diverge outward from the col in the atmospheric frame of reference. 
  • The tilt of the cyclonic vorticity tube in the vertical is toward the northwest. A very slow moving storm.
  • The source region of the warm conveyor belt was really deep into the tropics – full of heat and moisture energy.
  • The cyclonic shape of the warm conveyor belt strengthens the cyclonic companion of the WCB and the associated tiled vorticity tube. 
  • Sharp contrast between the moisture fields reflects the intensity of the physical processes generating them. 
  • There is much more but this is enough to reveal that this is going to be a very important storm…

Stephen King published in Storm of the Century in February 1999. The screenplay was televised as an American horror television miniseries. Unlike many other King miniseries, Storm of the Century was not based upon a Stephen King novel. It might have been based on the reality of six years previous. In the horror television miniseries a very powerful blizzard hits the fictional small town of Little Tall Island off the coast of Maine. The storm is so powerful that all access off the island is blocked, and no one is able to leave the island until the storm is over. Truth can be stranger than fiction.

Weather is important! And a good forecast can save your life... 

Warmest regards and keep your paddle in the water,
Phil the Forecaster

Tuesday, May 12, 2020

Langmuir Streaks – Take the time to Observe and Learn from Nature

#2203 "Langmuir Streak Sunset" Pixels Link
This is a look at the finer details in the larger flows. Even the smaller lines have a story to tell. Langmuir Streaks added to our tool box of conceptual models will give us all we need to better understand most everything we observe in a fluid.

Irving Langmuir (1881-1957) witnessed windrows of seaweed in the Sargasso Sea in 1927. His parents had encouraged him to be curious about the world and gave the advice to carefully observe nature. Apparently Irving listened and Irving constructed a conceptual model to explain his observations.

In physical oceanography, Langmuir circulation consists of a series of shallow, slow, counter-rotating vortices at the ocean's surface aligned with the wind. These circulations develop when wind blows steadily over the sea surface. Langmuir circulations circulate within the mixed shallow layer of the ocean. The helical circulations create bands of divergence and convergence at the surface. The circulation has been observed to occur up to 20° to the right of the wind in the northern hemisphere. 

I enjoyed similar patterns while paddling on inland lakes. I thought the lines of calmer water roughly paralleling the wind could be explained by the same processes described by Langmuir.
The atmosphere is just an ocean of air. When forecasting and observing the weather, one routinely observes rows of stratocumulus and cumulus in long streets paralleling the wind. Snowsqualls coming onshore off the Great Lakes have a similar structure. Why should these constructs be any different from the oceanic Langmuir Streaks?

I regularly witnessed atmospheric Langmuir streaks while I was painting warm conveyor belts en plein air in the mid 1990’s. I saw parallel streaks of cirrus that stretched along the wind direction. I wondered how those lines of thicker cloud might be explained. They were certainly not deformation zones which were and still are my go-to answer for any line in the sky. Could these cirrus formations be Langmuir processes as well?

The streaks of smoother and more reflective water I presume are the down-welling circulations induced by the wind and the associated flow in the lake. 
Langmuir streets have been well studied for their occurrence in bodies of water but pretty much ignored in the ocean of air. It surprised me that they were virtually unknown and unstudied in the world of meteorology. The processes in the gaseous fluids should be comparable if not identical to those in the seas. Langmuir streets exhibit the following.

There is a stable layer (tropopause among many others to confine the helical circulations).
There is a current in the fluid (jet stream among many others).
There is a material to make the primary current and secondary circulations visible (algae, water vapour and cloud).
Helical circulations roughly paralleling this current creates areas of convergence, divergence, updraft and downdraft.
The natural patterns are beautiful whether in the water or in the sunset sky.

Do be honest, I have constructed vorticity chains that create elongated deformation zone skins that parallel the flow. When smoothed over time and space these deformation zones form the edges of moisture streaks in the atmosphere – a kind of continuous smoke ring – more like a smoke tube. This conceptual model could also explain the observed moisture streaks. I prefer to let nature reveal which conceptual model might be more apt.

The answer could also be found by simply examining the actual circulations of these cloud shapes in closer detail. Jochen, a wonderful friend from EUMETSAT who specialized in time lapse photography of weather as well as RGB satellite imagery, probably has the answer. We learned a lot form each other. We are both retired now but it would not hurt to ask!

Moisture patterns and conceptual models are generally scalable with the size of the atmospheric processes that create them. Vortices of all sizes behave in pretty much the same way. 

Warmest regards and keep your paddle in the water,
Phil the Forecaster

Tuesday, May 5, 2020

The Cyclonic Side of Life

#2090 "Singleton Cirrus Sunset Fingers" Pixels Link 
In “The Relativity of the Companion Flows in the Warm Conveyor Belt”  I described the anticyclonic side of the warm conveyor belt found to the right of the central streamline. The warm conveyor belt flow has distinctly different personalities on opposite sides on the dividing streamline that points straight at the col of the deformation zone. The cyclonic companion is found to the left of this dividing line when looking along the direction of the flow.  The streamlines to the left of the divide rise and curl with the fingers of your right hand as they approach the deformation zone skin.  These anticyclonic and cyclonic swirls connect as described before in the “Unified Theory of Swirls”.  But it really helps to look at them separately in a bit more detail to really understand the weather.

The cyclonic side of warm conveyor belt is perhaps the most important in the entire conveyor belt conceptual model. I will explain why. If one follows the atmospheric frame of reference wind direction from the ground in the warm sector of the storm upward while remaining to the left of the dividing streamline and col, your arm initially points from the south. When you mentally rise above the sloped warm frontal surface your arm will turn to more from the southeast. As you continue to climb in your mind, your arm will twist more to pint from the east as it reaches the level of the upstream confluent asymptote of the deformation zone. If you recreate your arm motions with height, your arm twists counter-clockwise or backs with height. Winds backing with height is equivalent to the relative cooling of the atmosphere with height. Relative cooling aloft leads to destabilization of the vertical atmospheric profile. The proverbial hot air balloon will remain warmer than the cooling air at higher heights. This unstable profile keeps the hot air balloon rising. Such an unstable profile has large impacts on the weather and the shapes of the clouds.

Gravity waves are not common in the cyclonic companion. Gravity waves require a stable layer similar to the surface of a lake. The tropopause is the stable lid on the portion of the atmosphere which contains most weather and gravity waves can always be found in the cloud there. Otherwise the clouds to the left of the dividing line of the warm conveyor belt will be more cumulus in nature. The typical cloud types and their locations are indicated in the accompanying graphic.

Note that is typical to observe a minimum in cloud within the delta void adjacent to the col. The amount of moisture being directed into this void actually decreases as the strength of the swirls in the legs of the croquet hoop increases. An intense storm will display an obvious delta void.

Individual layers of moisture are typical at the leading edge of the warm conveyor belt. As the flow continues to direct more moisture and heat energy northward, these discrete layers of moisture will thicken and merge. Precipitation processes commence when the amalgamated cloud thickness exceeds four thousand feet. At this point the integrated cloud layer is called nimbostratus - it is precipitating at the ground.

If the cyclonic side of the warm conveyor belt is sufficiently unstable, convective cloud will continue to boil upward and develop from the cumulus stage into towering cumulus and eventually cumulonimbus or thunderstorms. These unstable clouds can be embedded within the nimbostratus as is typical along the warm front. Lines of convective cloud are also characteristic along the surface cold front.

The engine driving all of this weather on the cyclonic side of the warm conveyor belt is the cyclonic side of the croquet hoop. Moisture and heat is the fuel that feeds the rotation represented by your right hand with the thumb pointing upward. When precipitation processes start, water vapour condenses re-releasing the energy it required to vapourize in the first place. The heat energy powers the rising hot air balloons.  The upward pointing thumb gets bigger more intense which in turn increases the speed of rotation represented by your fingers. In effect the rotation spins up and the cyclonic side of the croquet hoop becomes a large cyclonic tube that extends through the depth of the atmosphere.  One can imagine the prima ballerina or ice skater extending their arms upward and really going for a spin in this atmospheric dance. Moisture bands will wrap around this vorticity tube like tree rings. The number of wraps is directly related to the strength and the age of the vorticity tube.

Further the tilt of this vorticity tube in the vertical reveals the speed of the associated conveyor belt conceptual model relative to the earth. If the tube tilts upward to the east, the storm is moving the same direction as the typical jet stream which moves the weather on average from west to east. The warm conveyor belt will also and will continue to move eastward. The storm will be short-lived at any one location. If the tube tilts upward to the west, the storm will be slow moving or even stationary. The atmospheric frame winds in this case oppose the typical jet stream. Both the duration and intensity of the precipitation are likely to be significant.

I analyzed a specific warm conveyor belt pattern for an artist friend. Note the minimum in the cloud at the col. It illustrates what can be seen from the earth frame of reference. The best place to witness all of these events unfold is through water vapour satellite imagery. The magic of seeing weather evolve through the view from the satellite is where we are headed.

Remember that there is no final exam on any of this material. I present it with the sincere desire that you might enjoy nature as much as I do... we need to work with and support nature. We are all in this together!

Warmest regards and keep your paddle in the water,
Phil the Forecaster