 |
| 0519 "Homestead -West Wind" Home and Watershed Farm in 1993 |
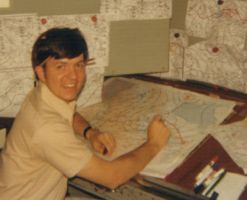 |
| Map Analysis 1977 |
Some of the fruit from that Golden Age of Meteorology has been the remarkable numerical simulations of the atmosphere of today. The Numerical Weather Prediction (NWP) ingests far more data and completes billions of calculations beyond what humans can do. The essential super computers produce remarkably accurate forecasts that span space and time around the Globe. Meteorologists use these tools to aid clients in the increasingly weather sensitive society. But it is still important that humans understand the nature of weather and that leads back to these posts.
The past few Blogs described how to interpret those isobars on the surface map and the height contours on the upper air charts.
We started with the Geostrophic Wind Balance and then added in the centrifugal force to achieve the Gradient Wind Balance. See "The Answer Really IS Blowing in the Wind" and "Another Look at the Wind". Finally we added in friction to understand what happens to the wind in the planetary boundary level (PBL) where we all live. See "Adding Friction to the Wind Balance". After those Blogs, we have a basic understanding of the wind.

Hand analyses are generally a thing of the past. The computer generated surface pattern from this past Saturday can still reveal what one needs to know. Blowing and drifting snow will restrict transportation and close schools as effectively as a general snowfall. To forecast those events can be complicated as it depends largely on the characteristics of the snow surface. The wind is the key factor though and those last three posts has gotten us to the point to answer those questions.
The geostrophic wind based on the extremely tight spacing of those isobars alone, would be an under-estimate of the real gradient wind. The isobars over the lower Great Lakes are nearly straight if not curved anticyclonically.

 |
| 850 mb Height Contour Chart for about the same time. Note that the winds at about 5000 feet above the surface away from friction, closely follow the height contours. |
The important forecast was that Saturday was going to be a very blustery day with south to southwest, gusty winds. For me that meant that I would not bother to shovel the lane or sidewalk as the snow would just drift back into place. I painted in the Singleton Studio instead.
No comments:
Post a Comment