Tuesday, August 18, 2020

Weather Lessons for Everyone from the Cold Conveyor Belt Wizard

#0505 "Ominous
The meteorological journey to get to this point started nine months ago. Some of the science steps were absolutely essential to justify the observations we are about to assert. Some strides were more for background, nice to know information. But where are we after this gestation period of these meteorological concepts?

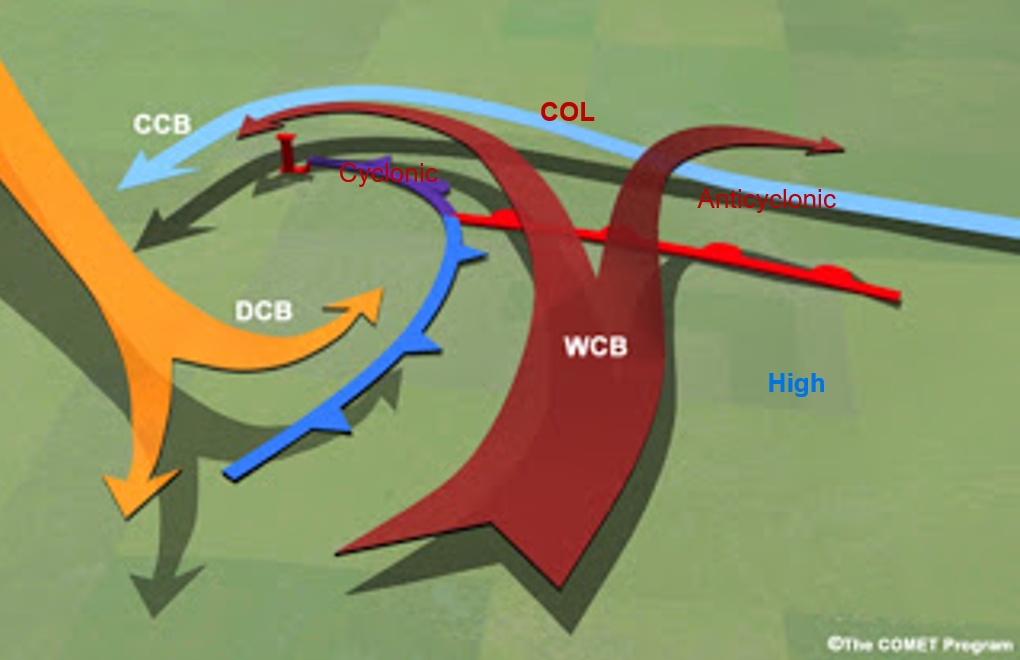
The cold conveyor belt (CCB blue arrow) holds lessons that the can teach everyone. We have already established how the cold conveyor belt can control the phase of the precipitation in some surprising ways. The cold conveyor belt can also reveal the characteristics of the entire mid-latitude storm through the Conveyor Belt Conceptual Model and the Weather Machine. Here is how that wizard works.

The premise is that a warm conveyor belt and storm is approaching your region. You are located within or under the Cold Conveyor Belt. This is what you observe:

The surface wind (the cold conveyor belt as measured in the earth frame of reference) has a westerly component. I used the large green arrow in the graphic to depict the surface wind result of the vector addition. This is the typical mid latitude storm that is moving steadily with the jet stream across the landscape. Cirrostratus arrives on the western horizon but the surface winds stay out of the southwest. The system crosses the area without hesitation. The precipitation, if there is any, comes and goes quickly. Stronger westerly winds signal the passage of the cold front and the system. The speed of the system relative to the earth (purple arrow) is faster than the atmospheric frame winds in the cold conveyor belt (blue arrow). The vector addition of these winds leaves a surface wind with a westerly component - the green arrow in the graphic.

The surface wind (the cold conveyor belt measured in the earth frame of reference) is calm. The mid latitude storm that is moving a bit slower across the landscape. Cirrostratus arrives on the western horizon and the surface winds gradually decrease in speed. The cirrus is slow to thicken up into altostratus.  The precipitation, if there is any, will arrive slower and last a bit longer. The calm winds will shift to the west with the passage of the cold front and the system. The speed of the system relative to the earth is about equal to the winds in the cold conveyor belt so that the vector addition of these purple and blue arrow winds balances out to provide the "calm before the storm".

The surface wind (the cold conveyor belt measured in the earth frame of reference) has an easterly component. The mid latitude storm is moving slowly across the landscape. Cirrostratus arrives on the western horizon and the surface winds gradually increase from the east. The cirrus is really slow to thicken up into altostratus.  The precipitation, if there is any, will arrive very slowly and last much longer. The easterly winds will shift to the west when the cold front arrives - but the storm is likely to last a while. The speed of the system relative to the earth (purple arrow) is slower than the winds in the cold conveyor belt (blue arrow) so that the vector addition of these winds generates surface winds out of the east – which are never good for man or beast.

In the previous three examples only the speed of the system was adjusted to arrive at the different evaluations of the storm. The strength of the wind in the conveyor belt system can also be adjusted. For example as the storm intensifies, the conveyor belt winds in the weather machine will also increase with speed. The effects of this can be evaluated by observing the results at the surface within the cold conveyor belt.

A fast moving system that still produces an easterly cold conveyor belt wind at the surface is a very strong storm indeed. It may cross the region quickly but the strength of the circulations will make it a force to be reckoned with. In general, the stronger the easterly surface winds in the cold conveyor belt, the more likely that the storm will last longer and probably be more intense as well.

By observing the surface wind in the cold conveyor belt portion of the storm, a keen observer can estimate how fast the system will cross their region as well as the intensity of the storm. If the observers also remember how to read the lines in the sky and have their right fingers handy, then they might also deduce which portion of the warm conveyor belt is likely to cross their position.


It took almost nine months to carefully establish the linkages between observing the surface wind to really understanding the weather. The pioneers had it figured out by observational trial and error. Their crops and lives depended on it. They recorded their findings in rhymes. Their weather poems and ditties would fill several books.

Personally, my meteorological training was much more book based. My university background was theoretical physics with an emphasis on nuclear. Back in 1976 I needed to pass a crash course in meteorology in order to stay employed with the then Atmospheric Environment Service of Canada. Fine academic textbooks on meteorology  (James R. Holton comes to mind) did not prepare me for the real world though. Happily, my plein air painting and the arrival of remote sensing did. I spent all of my career trying to really understand the weather from a more personal and natural perspective more akin to that of the pioneers.

Environment-based education is a current movement trying to reconnect students with the natural world. That is the unstated goal of my Art and Science Blog. The timing to present this material during COVID-19 was intentional. Observations of the natural world and the Cold Conveyor Belt in this example, can teach a lot. Technology and tablets may be glitzy but nature is real. Immersing yourself in the environment along with nature is where you can really begin to learn and to live. I would like to suggest some reading. The Last Child in the Woods and the Nature Principle by Richard Louv would be a good place to start.

Warmest regards and keep your paddle in the water,
Phil the Forecaster

PS: The real weather is always more complicated but these conceptual models will help you figure that out…

Tuesday, August 11, 2020

The Cold Conveyor Belt - The Wizard Controlling the Precipitation Type

#0418 "Sheena's Sky" Phil was about to learn
some meteorology from this one trick pony...
I am a firm believer in making mistakes. Ask anyone. I feel that you need to keep pushing the knowledge envelope to become skilled. Strive to learn. If you are not making mistakes, you are not learning. Nature is the best teacher and it is best to be always paying attention. One never knows when the next natural lesson will be presented.

Conveyor Belt Conceptual Model of a Mid-Latitude Storm
The humble Blue Arrow is the Cold Conveyor Belt but ignore
this Wizard of the Weather at your own risk.
I recall one Day Shift at the Ontario Storm Prediction Centre in the early 1990’s. The Cold Conveyor Belt taught me a lot. I made a tremendous number of mistakes – but I never made those mistakes again. A large and severe winter storm with a good feed of Gulf of Mexico moisture was developing with a huge warm conveyor belt. The equally impressive dry conveyor belt was carving a path through the dry slot in the comma cloud pattern. I was all over these dramatic patterns in the severe storm and excited to provide an accurate warning service.  I was in charge. Or was I? Then it happened.

Rain started to fall in the eastern forecast regions. This was a winter storm! No problem, we will fix the heavy snowfall warnings. The rain changed to freezing rain. Big problem! We had to really adjust the warnings. The freezing rain changed to ice pellets. What next? The ice pellets changed to heavy snow. Wonderful! We finally caught up to the weather that we were originally warning for but we had spent the morning back pedaling and confused. I learned a lot. I made even more mistakes. That day was burnt into my memory more than any of the forecast successes. The humble Cold Conveyor Belt had ruled the day and the weather. The Cold Conveyor Belt Wizard was pulling the strings behind the curtain of the three dimensional deformation zone.

Rain Sounding
The cold conveyor belt originates from low levels in the atmosphere poleward and east of the low pressure center. The cold and dry air is drawn toward the low. The operative word is actually “dry” instead of cold. In this case the temperature started above freezing but the dew-point was well below freezing.

The snow flakes were in their free-fall at 1 metre per second. Those flakes melted in the last kilometre of their descent. That explained the winter storm starting as rain.

Freezing Rain
The energy required to melt the snow flakes along with the saturation of that lowest kilometer of air created a profile with an above freezing layer of air aloft and below freezing near the ground. That explained the rain changing to super-cooled water droplets. These super-cooled water droplets freeze on contact producing a treacherous ice glaze on exposed surface - freezing rain.

Ice Pellets Type A
The continued cooling and saturation of the air mass increased the amount of cold air at the surface. The super-cooled water droplets were freezing within the deeper cold layer at the ground thus converting the freezing rain to less dangerous ice pellets.

Snow
The continued loss of energy required to melt the snow flakes and saturate the air mass in the lowest kilometre cooled the entire profile to the wet-bulb temperature and eliminated the above freezing layer aloft. The falling snow would fall that lowest kilometer and remain unchanged as large dendritic flakes. These large flakes would accumulate quickly and verify our original warning. Before that happened though the cold conveyor belt had been exceedingly dry and taught me a lot of lessons.

I quietly slid the term wet-bulb temperature in the previous paragraph. At 100% relative humidity, the wet-bulb temperature is equal to the air temperature (dry-bulb temperature). In dry air, the wet-bulb temperature is achieved by evapourating water into the air parcels and taking the latent heat required to do that evapouration from the air parcel itself. The wet-bulb temperature is a conservative property of air as it moves in the conveyor belts of a storm. The wet-bulb temperature is the lowest temperature that can be reached under current ambient conditions by the evaporation of water only.

The cold conveyor belt taught lessons about precipitation typing and the wet-bulb temperature that day. It also taught about the perils of being distracted by large and energetic patterns while neglecting the subtle features of the wizard behind the deformation zone curtain. This weather is now called a "wintry mix" by the media thus side-stepping the potential challenges and science. I feel it is best to understand and work with nature - and never leave home during a freezing rain event.

Warmest regards and keep your paddle in the water,
Phil the Forecaster Chadwick

Next is how the Cold Conveyor Belt can make you a better weather observer. 

Tuesday, July 28, 2020

The Cold Conveyor Belt - The Weather Wizard Behind the Curtain

#0828 "Standing Outside the Fire" Pixels Link

It might be surprising to claim that the last conveyor belt to study is also the most important. Why? How? The flamboyant Warm Conveyor Belt takes heat and moisture energy as it rises northward. The powerful Dry Conveyor Belt transports dry and cool air to the south as it sinks. Both of these actions help to keep the earth in an energy balance. Both are responsible for the bulk of the energy found in mid-latitude storms.The Cold Conveyor Belt is not even wound up with any of the gears in the weather machine.
The Weather Machine
 Conveyor Belts Powering the Weather Cogs
of Swirls and Vorticity Tubes

Ahhh... but the cold conveyor belt controls the location of the surface warm front, the character of the precipitation and more importantly, it is the one that can keep people in touch with the nature of the weather. This will take some explaining.

The Cold Conveyor Belt (marked CCB in the figure as the blue flow) is even a challenge to analyze and diagnose. Typically this important flow is hidden under both the rising and moist Warm Conveyor Belt and even the sinking Dry Conveyor Belt - important partners in the weather dance. The Cold Conveyor Belt can’t even be seen on my go-to water vapour imagery. In fact, my observational platform for the Cold Conveyor Belt is actually Doppler Radar.

By relying on radar the important advantage of event lead time is largely lost. The severe weather forecaster becomes more of a severe weather observer when precipitation is required to witness the occurrence of an event. The patterns revealed on Doppler require precipitation to reveal the conveyor belts. Those Doppler radar patterns in the Cold Conveyor Belt can also be really complex. New Dual Pole Radar is extremely beneficial as well but again the events must already be happening to be revealed by the hydrometers being blown around with the winds.

The Satellite Palette which was largely published through COMET was based on my belief that satellite imagery was very much more than a cloud-no cloud observational tool. The cloud shapes and their characteristics reveal the weather story if one only understands the vocabulary. In addition I was convinced that radar was a lot more than just a rain-no rain observation. Together the patterns revealed in the satellite and radar imagery describe space, time and trends and could reveal what the real atmosphere was really up to.

The radar patterns were potentially more complex and full of artificial artifacts so I started with the satellite. But I believed that the same principles that I had applied to the satellite data could also be applied to the radar patterns. The Radar Palette was born. I thought that the interpretation of patterns was as much an art as a science so it was a logical sequence of study for me. This effort did not get published. I guess we just ran out of time. Meteorologists really liked the Radar Palette over in NOMEK and Scandinavia though.

PowerPoint Splash Landing Page for the Radar Palette
The Radar Palette was based on the Conveyor Belt Conceptual Model. Classic examples of conventional and Doppler radar images were archived from every part of the mid-latitude storm. I used PowerPoint to link the main Entry-Splash Page to these examples. Each link included a description of the classic signatures, how to analyze and diagnose them  and most importantly, what they meant for the weather machine. The PowerPoint approach was clunky but it worked well enough as a prototype waiting for the expertise of COMET to make the material come alive. I just wanted to demonstrate the potential of the Radar Palette. In the Entry-Splash Page the “C” stands for conventional radar, the “D” stands for Doppler while the “DP” was for Dual Pole which was coming on-line in 2007. Here are just a few samples of some of the concepts and radar patterns. I have not thought of this effort in over a decade so revisiting this brought back a lot of memories.

Here is the reference sheet for the Cold Conveyor Belt and its relation to the Warm Conveyor Belt. The cold air always leads in any weather dance. The light-headed warm air will ride over the dense cold air with a typical slope of a rise of 1 kilometre for every 200 kilometres of distance perpendicular to the surface front. Remember that every front is just the surface reflection of the three dimensional deformation zone skin which encapsulates the air mass. If the cold air is doing the soft shoe shuffle northward then the warm air at the surface must advance. If the cold air is doing the stroll parallel to the deformation zone then the front will be quasistationary.

It would take several books to thoroughly explain all of this effort but may I touch on a few things just to give you the idea of why remote sensing is so vital. I will focus on Doppler as conventional radar has been around since World War II and Dual Pole radars are still likely being deployed. The Doppler isodop is very important. The veering or backing of the isodop and the area enclosed can be related to the relative magnitudes of the warm and cold advections in the lower atmosphere.

I have presented “Basic Operational Doppler Applications” just a few times starting around 2007. The analysis and diagnosis of the Cold Conveyor Belt are vital to getting the precipitation forecast right. Important meteorology like warm and cold advection could be observed using Doppler. Differential thermal advections in the vertical could also reveal changes in stability. I named these characteristic patterns with catchy names in the hope that they might stick. I was especially proud of the “Screaming Eagle” pattern. I am still hoping that this material will gain an audience as optimism and persistence can be a good things.
The Warm Screaming Eagle Pattern
If I may, I will reproduce a very few of these patterns and my Doppler applications here. It is not rocket science but it is close. I used these techniques to better understand the hidden Cold Conveyor Belt. The effort was worth it though in light of the fact that the Cold Conveyor Belt helps to controls the phase of the precipitation as well as the longevity of rare but vitally important events like freezing rain. The CCB is the Weather Wizard like the Professor of Oz who hid behind the curtain pulling the strings. 
The Headless Eagle Pattern
 
The Headless Gull Pattern


The Cold Conveyor Belt is best investigated by simple observations that anyone can do. That is the subject for next Tuesday Science. It encourages us all to get out into nature to appreciate the beauty and science of the natural world. That is where we learn best...

Warmest regards and keep your paddle in the water,
Phil the Forecaster Chadwick

PS: There will be NO exam on this material...


Tuesday, July 21, 2020

The Jet Stream - The Bind that Ties

#1061 "Windy St Lawrence" Pixels Link
The dry conveyor belt is intrinsically tied to the warm conveyor belt by the jet stream. In the early years I used the longer phrase “axis of maximum winds” as a general term to describe the wind that was shaping the satellite patterns. The unusual shapes that I was trying to describe and understand on those grainy early 1980 satellite images did not match the Venn Diagrams that we were taught in the Training Branch of the Atmospheric Environmental Service. Those early meteorological cookbooks tried to simplify techniques to better forecast the weather . This was before before computer simulations of the atmosphere really started to improve. The location and characteristics of the jet stream was the number one priority to better prediction of the weather.
A PowerPoint Screen from my Teaching Days
with COMET, NOMEK and EUMETSAT

There were four basic ingredients in the jet stream menu.
• Find the dry slot in the comma pattern
• Baroclinic zone cirrus streaks
• Low cloud discontinuities
• Connect the dots located above.

The strongest winds or the jet maxima (the J in the accompanying graphic) were located in the dry slot and downstream from the col.

Using the new tool of satellite imagery and these simple ingredients led to more discoveries. The conveyor belt conceptual model was the first and foremost among those.

The Weather Machine Cogs or Swirls lay down
three dimensional deformation zone skins
 that encapsulate the weather. 
The jet stream is like the broad leather belt in the conveyor belt machine wrapped around the drive wheels of the weather engine. The axis of maximum winds spins up the cyclonic tube of the smoke ring in the trough. The jet then ascends the ridge to spin the anticyclonic tube before exiting into the next system downstream. The jet stream or axis of maximum winds powers and ties the cogs of the dry conveyor belt to those of the warm conveyor belt. If you really want to learn about a system, you need to follow the energy….

I always found it important to go back to first principles to explain how the mid latitude storms were fueled. All of the energy must ultimately come from the sun and this energy needs to be moved around the Globe to keep everything in balance. Every closed system must find its balance. 

Zonal Jet Stream
The sun heats the darker earth tones of the lower altitudes. Those surfaces are nearly perpendicular to the sun’s rays through most of the year. At higher latitudes the earth surfaces are more likely to be covered by reflective snow and ice. The inclined surfaces receive only a glancing exposure to the sun’s rays. The poles do not soak in nearly as much heat energy as the equatorial regions. 

The zonal jet stream results from the temperature difference between the equator and the poles. The jet stream blows from west to east. This thermal wind direction is easy to remember. If you keep your right hand in the warm air and your left hand in the cold air, you are looking in the direction of the wind caused by the contrasting temperature. 

Increasingly Meridional Jet Stream
This zonal jet does not move heat energy around. Weather happens as the jet stream becomes more meridional.  Typically the storms become stronger and slower moving as the jet stream flows increasingly meridional as it plunges southward around deep troughs before rising downstream around the large upper ridge. 

The conveyor belt conceptual model explains how warm air is moved northward and cold air to the south and how meridional flows relate to the weather. 

There is another important source of energy. The energy in the water cycle also comes from the sun. Water evaporated from the earth requires the heat of vapourization to change from a liquid to a gas. The heat of sublimation is needed for a solid to change to the vapour phase. The conveyor belts move water in all of its forms around the globe. The energy inherent in the phases of water moves with those winds as well. 

White and dark blue bubbles on this Canada Day Water Vapour
image are convective bubbles rising off the isentropic surfaces
Water vapour rises in the isentropic ascending flow of the warm conveyor belt. The vapour cools and at some point returns back to either a liquid (rain) or solid form (snow) with the release of that heat energy back into the atmosphere. Those air parcels where the precipitation is created from the vapour, are suddenly heated and they explode off the constant energy surface of the isentrope. These warmed parcels rise like hot air balloons to much higher potential temperature surfaces in the atmosphere. Meteorologists call these ascending air parcels convectively unstable. The release of energy from the change of state fuels the cyclonic swirl, the warm conveyor belt, the precipitation and the vertical convection. Water vapour imagery dramatically reveals those parcels convectively leaving the isentropic surfaces. 

A similar but opposite process can occur in the dry conveyor. Any liquid or solid phase water within the dry conveyor belt can cool air parcels containing them as they vapourize to a gaseous phase. The bubbles of parcels of cooled gaseous water vapour can sink like the proverbially lead balloon. You can feel these cold parcels of air under virga. Evapourating rain drops cool those bubbles of air often before a few of them actually succeed in reaching the ground thus creating a shower. 

The following animation from Canada Day reveals the wealth of meteorological information that may be gleaned from the relative motions of the warm and dry conveyor belts - that is the real weather. 


These are the big energy sources that fuel the conveyor belt conceptual model and mid latitude weather and storms. This energy all comes from the sun... and it happens in an exceedingly thin atmosphere about a twentieth of the thickness of the skin of an apple if an apple was the size of the earth... 

That's enough for today... but it ties the dry and warm conveyor belts together and binds it with the energy from the sun... and yes, I am dyslexic ...

Warmest regards and keep your paddle in the water,
Phil the Forecaster Chadwick

Tuesday, July 14, 2020

Finishing The Dry Conveyor Belt

#2047 "New Beginning Sunrise" Pixels Link 

The conveyor belt conceptual model of the wind patterns found with a mid-latitude low pressure area, is fundamental to the understanding of cloud patterns. Note that the term “cyclone” is frequently used to replace “low pressure area”. The idealized conveyor belts are in the atmospheric frame of reference relative to the low.
The Conveyor Belt Conceptual Model 
The dry conveyor belt (DCB - Orange Arrow) is the contrasting dance partner for the warm conveyor belt in the weather ballet. The DCB originates from high levels and follows the constant energy isentropic surfaces downward as it plows toward the south on the western flank of the warm conveyor belt (WCB). The dry air is relatively dry to start with and becomes drier and warmer as it descends. There are minimal cloud tracers and the atmosphere uses invisible ink to write this part story in the storm. The water vapour is key to diagnosing the DCB as described in the previous post “Reading Water Vapour Patterns“. The croquet hoop and smoke ring analogies can still be used but without cloud or smoke, one must use your imagination to visualize the circulation.
Descending Smoke Ring to Croquet Hoop Analogy
The leading edge of the DCB is also a bowed shaped deformation zone. The anticyclonic branch of the DCB tends to penetrate further south and lower in the atmosphere. This anticyclonic companion flow is drier, lower and warmer that its cyclonic companion across the DCB flow. The cyclonic companion typically turns back northward and rises on the sloped isentropic surfaces. These DCB circulations help to define the character of the cyclonic companion of the warm conveyor belt and the associated cold front.
 The katabatic or inactive portion of the cold front is typically associated with the anticyclonic branch. The warm air above any katabatic cold front is actually descending. Any cloud associated with a katabatic front tends to be well ahead of the surface wind shift and cold front.

The cyclonic branch does not descend as far and tends to wrap around the cyclonic circulation which is the low pressure area for the mid-latitude storm. The anabatic or active portion of the cold front is typically associated with the cyclonic branch. The warm air any anabatic cold front is ascending and thus promoting the development of cloud and precipitation – most of which occurs behind the surface wind shift and cold front.

The col in the bow of the DCB deformation zone separate the weather regimes and the anabatic and katabatic portions of the cold front.

The Water Vapour from June 1st 2020
The area of thew DCB is clear on the
corresponding visible imagery
Flows in the atmosphere are rarely as smooth as flowchart arrows. The dry conveyor belt (DCB) tends to be segmented into pulses associated with local wind maxima that move along the jet stream axis and energize the cyclone. These are called jet streaks and they will be another subject for a blog entry – jet streaks are that important too. This cross section is perpendicular to the WCB flow and shows how multiple DCB bursts might interact. Secondary lines of cloud can be expected where these DCB pulses collide with the cyclonic companion of the warm conveyor belt.  Water vapour imagery is essential to analyzing these DCB pulses. Each pulse will bring a burst of stronger winds toward the ground.

Every line in the water vapour imagery has a story to tell and the conceptual models are your keys to unlocking and understanding the wonder of weather. Meteorologists typically analyze the first pulse of dry air. The other pulses are invisible without the aid of the WV imagery. The movement of dry air is every bit as important as the circulations of clouds.

Here is a weather information site created and maintained by my friends in Boulder, Colorado. I think you will find it very useful.

http://weather.rap.ucar.edu/satellite/ and select  Water Vapor (mid)

That's enough for today... much more to come.
Warmest regards and keep your paddle in the water,

Phil the Forecaster Chadwick

Tuesday, July 7, 2020

Reading Water Vapour Patterns

#1282 "Singleton Sunrise-2013" Pixels Link
Patterns in the free atmosphere are created by the relative winds. These winds shape the weather as well. The system relative winds are the same as those that flow in the conveyor belt conceptual model. Historically we developed the tools to understand these patterns with respect to cloud. In the early days before water vapour imagery, clouds were all that Joni Mitchell and I had and could see.  We had to study them from both sides to really understand what they were saying. Now we can also read the invisible ink written in the skies.

GOES 4
(GOES D through H looked the same -
the number replaced the letter after launch)
Water vapour imagery came along in the 1980’s just as I was starting my meteorological career. GOES-4 was launched in 1980 and could produce imagery beyond the simple visible and infra-red. The water vapour imagery was low resolution and grainy. We were just were learning what it had to say and its "voice" was muffled. GOES-7 (GOES-H before becoming operational) was launched in 1987 and water vapour became really useful then. The same cloud patterns I was using to deduce the atmospheric relative winds could also be found in the higher resolution water vapour imagery – even in the dry air. Amazing! You can do it too.

We have been re-developing these tools from those early days in these Weather Blogs. I will summarize those methods here and you can see how they work on the water vapour imagery from Canada Day. Learning is best done by doing rather than just watching.

In the free atmosphere away from the effects of surface geography:

Linear Shapes

  • Gravity waves are perpendicular to the winds like waves on a lake. Gravity waves are regularly spaced with a wavelength that increases with the speed of the wind;
  • Elongated Langmuir Streaks are parallel to the winds. Generally two to four parallel Langmuir streaks can be found and they are generally larger and longer with increasing wind speed;
  • Deformation Zones located at the leading edge of an air mass are perpendicular to the direction of motion of that flow. The speed of advancement of the air mass is directly related to the increasing curvature of the bow shape

Swirl Shapes
  • Swirl shapes are created by rotation in the atmosphere. The three dimensional “smoke ring” in the atmosphere creates the following patterns which are mainly seen in the quasi horizontal layers of moist or dry air.
  • Wind shear is simply a rotation that is moving faster than the speed of that swirl's rotation. Rotation and wind shear results in curvature in the atmospheric flow. 
  • The jet stream reveals the large scale wave patterns of curvature. An upper trough is where the jet stream curves cyclonically around a southern penetration of cool air. You can think of an upper trough as a large cyclonic swirl and within it you will find smaller cyclonic swirls. An upper ridge is where the jet stream curves anticyclonically around a northern penetration of warm air. An upper ridge is a large anticyclonic swirl. It really is that simple.
  • Align the fingers of your right hand with the elongated features of a swirl while pointing those fingers in the direction of the flow. Your thumb will reveal whether the atmosphere is prone to rising or sinking motion.
Cyclonic Swirls or Vorticity Maxima
  • Aligning the fingers of your right hand with the flow around a cyclonic swirl will point your thumb must point upward. The air is swirling counterclockwise - cyclonically. 
  • Air is typically ascending with and ahead of the cyclonic swirl. 
  • Located to the left of the axis of maximum winds when looking in the same direction that the wind is blowing. 
  • Typically located in an upper trough which is the equivalent of a valley in the atmosphere. Atmosphere relative winds blow with cyclonic curvature through the trough.
Anticyclonic Swirls or Vorticity Minima
  • An anticyclonic swirl aligns the feature edges and the fingers of your right hand and also requires that your thumb point downward. 
  • Air is typically descending with and ahead of the cyclonic swirl. 
  • Located to the right of the axis of maximum winds when looking in the same direction as the wind is blowing. 
  • Typically located in the crest of the atmospheric wave pattern which is the equivalent of a ridge in the atmosphere. Atmosphere relative winds blow with anticyclonic curvature through the ridge.

Additional Concepts
  • Patterns get bigger with time until they dissolve away.
  • Follow the flow and connect the dots where you have obvious clues to the atmospheric relative wind direction. 
  • Situational Awareness and Conceptual Models - If you know the weather situation then you can anticipate the conceptual model that applies. I have only really presented the Deformation Zone the Conveyor Belt Conceptual Models but be assured, there are many more. They typically came to me on night shifts. 
Animation - Time is the Fourth Dimension

Try to view the movement of the elements relative to the mean flow of the system. It can be hard to do. The earth frame motion is the mean flow with the addition of the system relative flow. Conceptual models use the system relative flow which is what we want to understand since the relative winds shape the patterns. Situational awareness and conceptual models will help identify the system relative motion. If you know what the feature is then you know how it typically moves in the conceptual model.
Canada Day 2020 Water Vapour Image
These patterns can be found in both the moisture and the dry air of water vapour imagery and are generated in the free atmosphere by often subtle variations in wind speed or direction. These winds make the weather.

Here are a few of the shapes I saw... it is enough just to find the big ones - they are most important anyway. 

Our understanding of the atmosphere continue to improve. The movement of dry air is every bit as important as the circulations of clouds. Here is a weather information site created and maintained by my friends in Boulder, Colorado. I think you will find it very useful.

http://weather.rap.ucar.edu/satellite/ and select  Water Vapor (mid)

That's enough for today... much more to come.

Warmest regards and keep your paddle in the water,
Phil the Forecaster Chadwick

Wednesday, July 1, 2020

Turtle Nesting Project 2020 Report

The first turtle nest was found on June 5th 2020. It had already been dug up. With COVID and no grand kids around to watch, it was a challenge to locate the turtle nests before predation. We often had five or more turtles wandering around the property. They may not be Ninja turtles but it is still easy for them to elude watchful eyes. The nesting activity has slowed to a stop. I figure that the raccoons got between 15 and 20 nests while I managed to protect 10 - the same as in 2019. The odds of a turtle egg making it to maturity is apparently only 0.3%. At Singleton Lake I try to improve on those odds.

Snapping Turtle Tracks and Nesting Snapper
Northern Map Turtle in Soil
I have provided the turtles with nesting materials that range from coarse sand to limestone crusher run to inch gravel or larger. There is also a lot of dirt to pick from. All of these sites have great exposure to the sun.

The painted turtles seem to like the herb garden and the dirt. The northern map and snapping turtles like the sand and crusher run although the northern maps also go for the large gravel. I did not see any of  the musk turtles this year.

A Pair of Northern Map Nests in Gravel
The trick is to quietly mark the nest during the laying procedure. The turtles do an excellent job of packing the material back down and covering the eggs over. It takes a real Turtle Tracker to find an unmarked nest without the female turtle on it. After they leave I place protection on the nest as shown. The first night or two is crucial to keeping the persistent raccoons out. Layers of protection are gradually removed to ensure good solar heating. By late July the nests are uncovered and nature takes over.
One or two heavy steel grates Topped with Mesh Boards

Some turtles hatch out in September and October but I also see lots of turtles in the spring, having over-wintered in the nest. These turtles all get a free ride to the marsh.
Snapping turtles emerging from the nest - 29 of them at least

Apparently 80 percent of snapping turtle nests get predated. I expect those statistics apply to all turtles. Snapping turtles often live more than 100 years with a maximum theoretical life span of 170 years. The lifespan of turtles seems to correlate with their size. I have read that the smaller northern map turtles can be expected to survive 20 years.

Cultures around the world have various stories about how our homeland has been built on the back of a giant turtle. It is a nice thought that by protecting the humble turtle we are also respecting our homeland. 

Tuesday, June 30, 2020

Enhancing the Satellite View of the Atmosphere

#2059 "Singleton Sunset Reflection" Pixels Link
An important digression before we return to the dry conveyor belt story which is written in the invisible ink of dry  air... it is important to appreciate the importance of satellite imagery and water vapour in particular in understanding the conveyor belts conceptual model and the atmosphere around us.

Historically I preferred using simple grey scale enhancements in satellite imagery. A particulart shade of grey can be related to the brightness or energy returned from every point in the image. A smart enhancement only spends those grey shades over the energy levels that one should expect to observe. That was the premise for those early days when I created special enhancements for the sunrise and sunset periods in order to glean every last bit of information from the visible satellite imagery. The relativity between the brightness of every picture element or pixel in the scene was preserved but greatly enhanced. The resulting pattern could be better interpreted as to what it meant meteorologically just in time for the early morning forecasts.
Enhanced Visible Imagery from 1981 and 1982
The human eye can really only see 30 shades of grey depending on the lighting. In the early days of satellite and computer technology I would struggle to see more than 15 different shades of grey . The images and their messages got fuzzy. If seeing the pattern is a challenge then that shape and the meteorology it represents are probably not worth finding anyway. The analysis and diagnosis of iffy  pixels was not justifiable.

On a colourful note, the human eye is capable of detecting around 10 million unique colours. Of course these colours need to be selected prudently to display the brightness temperatures from the satellite. The use of an excessive number of colours can result in an abstract work of art and science. Meteorologists can get as easily confused as anyone else. The use of these colours can highlight specific meteorologically important quantities and processes that might otherwise be missed in the world and whorls of black and white. I employed a lot of colours in my work with infra-red satellite imagery in those early days.

The water vapour enhancements used by UCAR are suitably linear and simple. They are as good as it gets for use in diagnosing the atmospheric conveyor belts. The subtle patterns and shapes in the water vapour pixel topography are greatly enhanced. The rising surfaces of the warm conveyor belt comprised of high and cold water vapour are displayed in cool shades of purple and green. The sinking dry and warm conveyor belt is witnessed in hot shades of orange and red - artistic earth tones. A linear grey scale is used to exhibit the water vapour surfaces between these cold and hot extremes. This three way use of colour and grey shades reveal to the human eye the very important physical processes that create the weather in our atmosphere. Water vapour imagery taught me about the importance of one’s frame of reference and swirls. The natural patterns are really quite beautiful as well. The science in the art was unmistakable.

Not everyone sees things the same way though. I used a lot of arm waving and right hand thumbs while in the Atmospheric Environment Service Training Branch, in an attempt to explain what the water vapour imagery was saying. Some of that material is included in these Blog Journals. At that time the message of the satellite imagery was competing with the very seductive numerical presentations of the weather. The numerical weather prediction (NWP) was getting much better and prettier by the month. Remote sensing depicted the real atmosphere but there were concerns and deciphering the messages in the satellite data could be challenging.
Two of the several geostationary satellites above the equator

The geostationary satellites parked above the equator provide terrific imagery in terms of time and space continuity. The drawback with this singular view is that layers of high water vapour in the lower latitudes can obscure important meteorological features below. The graphic will explain this concern.
High Level Moisture Obscures Lower Level Processes
In addition, it can be a challenge to "see" the water vapour imagery in the three dimensions that the atmosphere moves in. One needs imagination to envision what is not painted in the picture.

Looking northeast across North America
One day in 2012 during a break with my COMET friends in Boulder, I expressed a dream to make the three dimensionality of the water vapour (WV) more obvious. If we could only use the WV brightness temperature as the vertical axis and turn the water vapour into a 3-dimensional image... wouldn't that be instructive! It maybe took a day for the creative folks at COMET to achieve that dream. Here are the first examples of what the water vapour can reveal in 3-dimensions. The water vapour topographical surfaces could be turned and twisted into any orientation on the computer screen. The atmospheric secrets were obvious when you enhanced for them. The images can still not reveal what is hidden under higher level obscurations but the three dimensional flows of the conveyor belts were recognizable. This imagery could be produced in real time to aid the meteorologist. I was disappointed when few others were as excited as I was about this development. Sadly, it reminded me of my experience with enhanced visible imagery from the early eighties.
Looking southeast across North America
Those same co-workers are not yet retired and are working on interactive displays to allow the curious to walk through the conveyor belt conceptual model (coming in a future blog) among other meteorological concepts. These same approaches will also allow people to stroll through the weather forecast in four-dimensions including time ... imagine!

The natural world is a terrific and fascinating place. Technology may help us to understand and appreciate it before it is too late! This reminds me of Joni Mitchell's “Big Yellow Taxi”.

"They paved paradise And put up a parking lot With a pink hotel, a boutique 
And a swinging hot spot 
Don't it always seem to go 
That you don't know what you've got Till it's gone 
They paved paradise..."

In any event, weather satellites and our understanding of the atmosphere continue to improve. The movement of dry air is every bit as important as the circulations of clouds. Here is a weather information site created and maintained by my friends in Boulder, Colorado. I think you will find it very useful.

http://weather.rap.ucar.edu/satellite/ and select  Water Vapor (mid)

That's enough for today... much more to come. 

Warmest regards and keep your paddle in the water,
Phil the Forecaster Chadwick